Weather
Current
Historical
Yesterday
Precipitation
Temperature
Station Graphs
Map Explorer
Photos
Station Photos
Snow Depth Photos
Soil
Current Soil Temperature & Moisture
Weekly Soil Changes
Agriculture
Growing Degree Days
Drought
Ag Tools
Cattle Comfort Index
White Mold
Delta-T Forecast
Other Ag Tools
Climate
Recent Climate Statistics
Climate Normals
Frost & Freeze Normals
Forecast
NDAWN Home
Home
Weather
Temperature
NDAWN
Minnesota
Average Temperatures
Average Temperature - Past 3 Days
View Larger Image
Average Temperature - Past 5 Days
View Larger Image
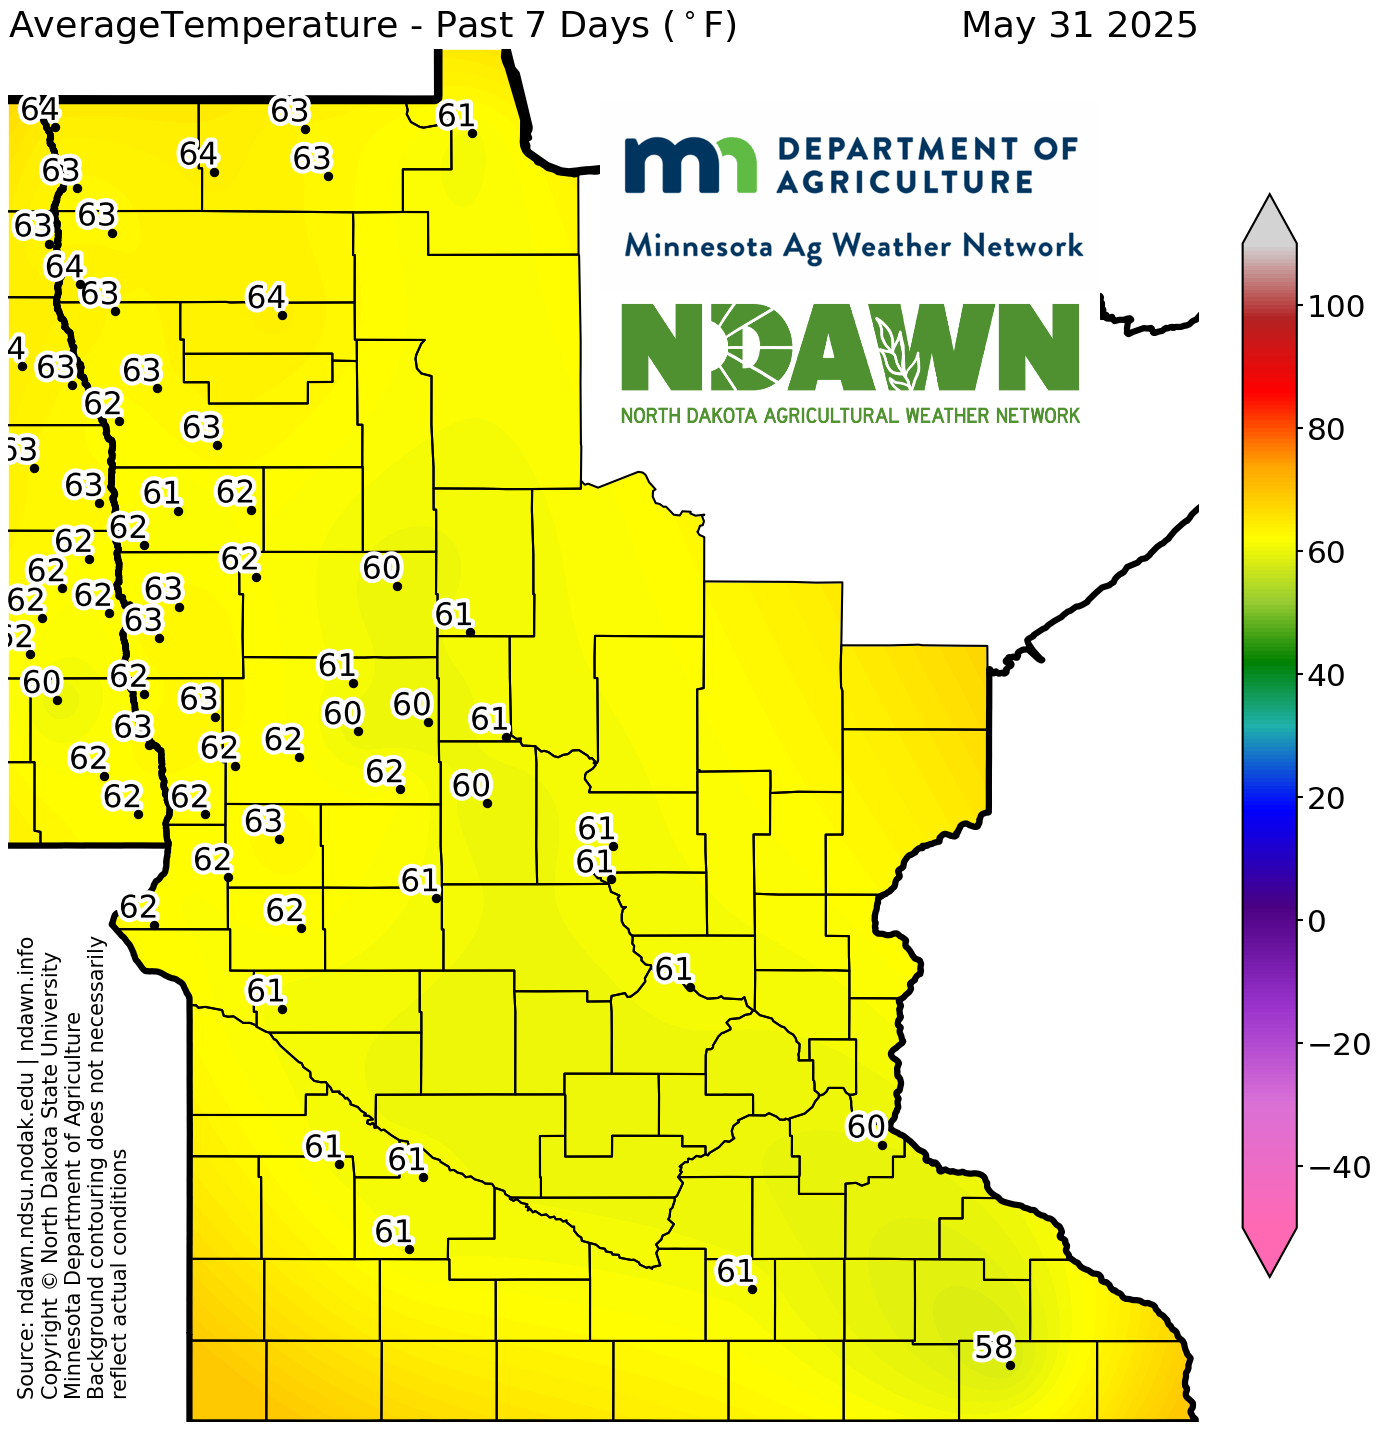
Average Temperature - Past 7 Days
View Larger Image
Average Temperature - Past 10 Days
View Larger Image
Average Temperature - Past 14 Days
View Larger Image
Average Temperature - Past 30 Days
View Larger Image
Average Temperature - Past 60 Days
View Larger Image
Average Temperature - Current Month
View Larger Image
Average Temperature - Since January 1, 2026
View Larger Image
Average Temperature - Since May 1, 2026
View Larger Image
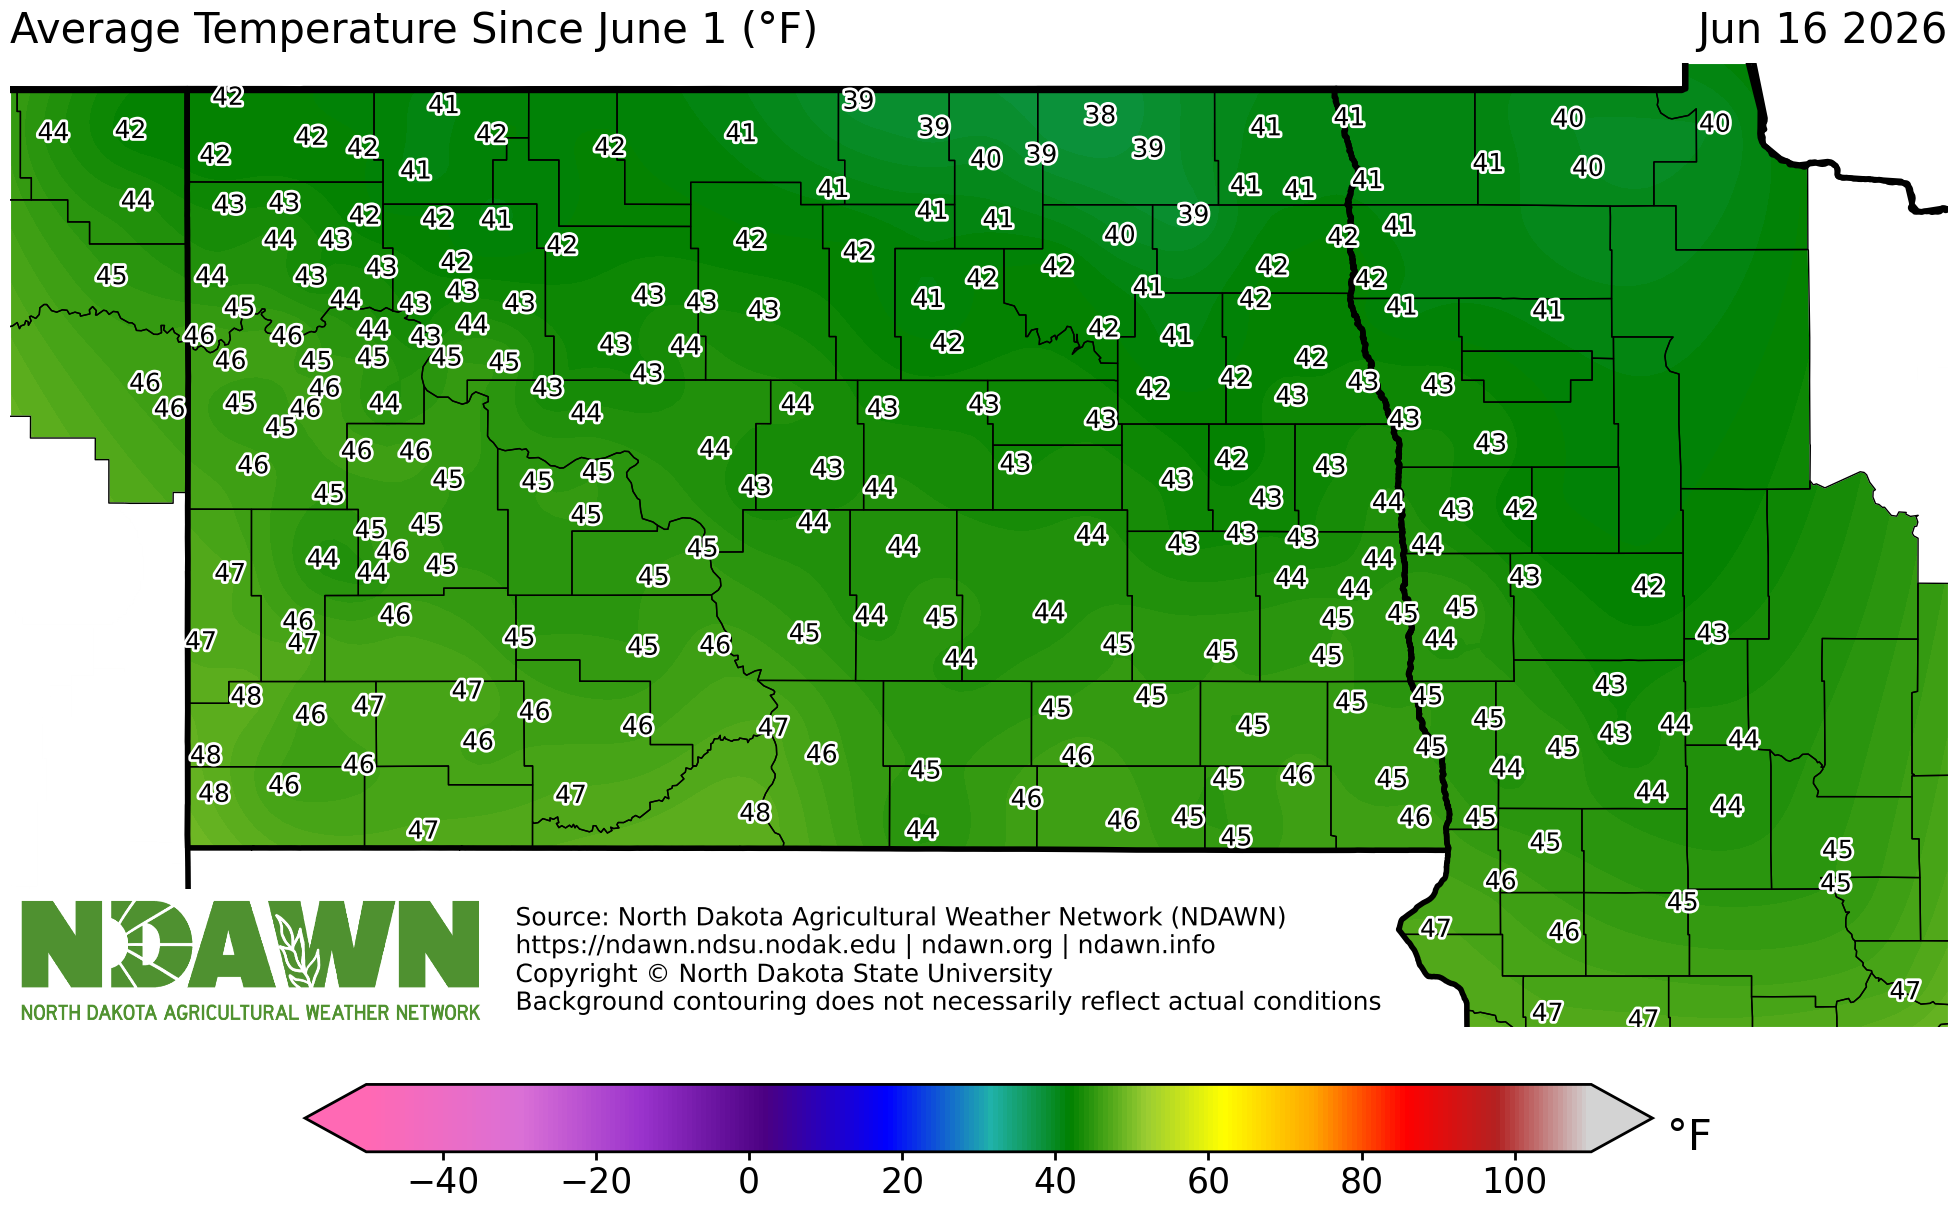
Average Temperature - Since June 1, 2026
View Larger Image
Departure from Normal Temperature
Departure from Normal Temperature - Past 3 Days
View Larger Image
Departure from Normal Temperature - Past 5 Days
View Larger Image
Departure from Normal Temperature - Past 7 Days
View Larger Image
Departure from Normal Temperature - Past 10 Days
View Larger Image
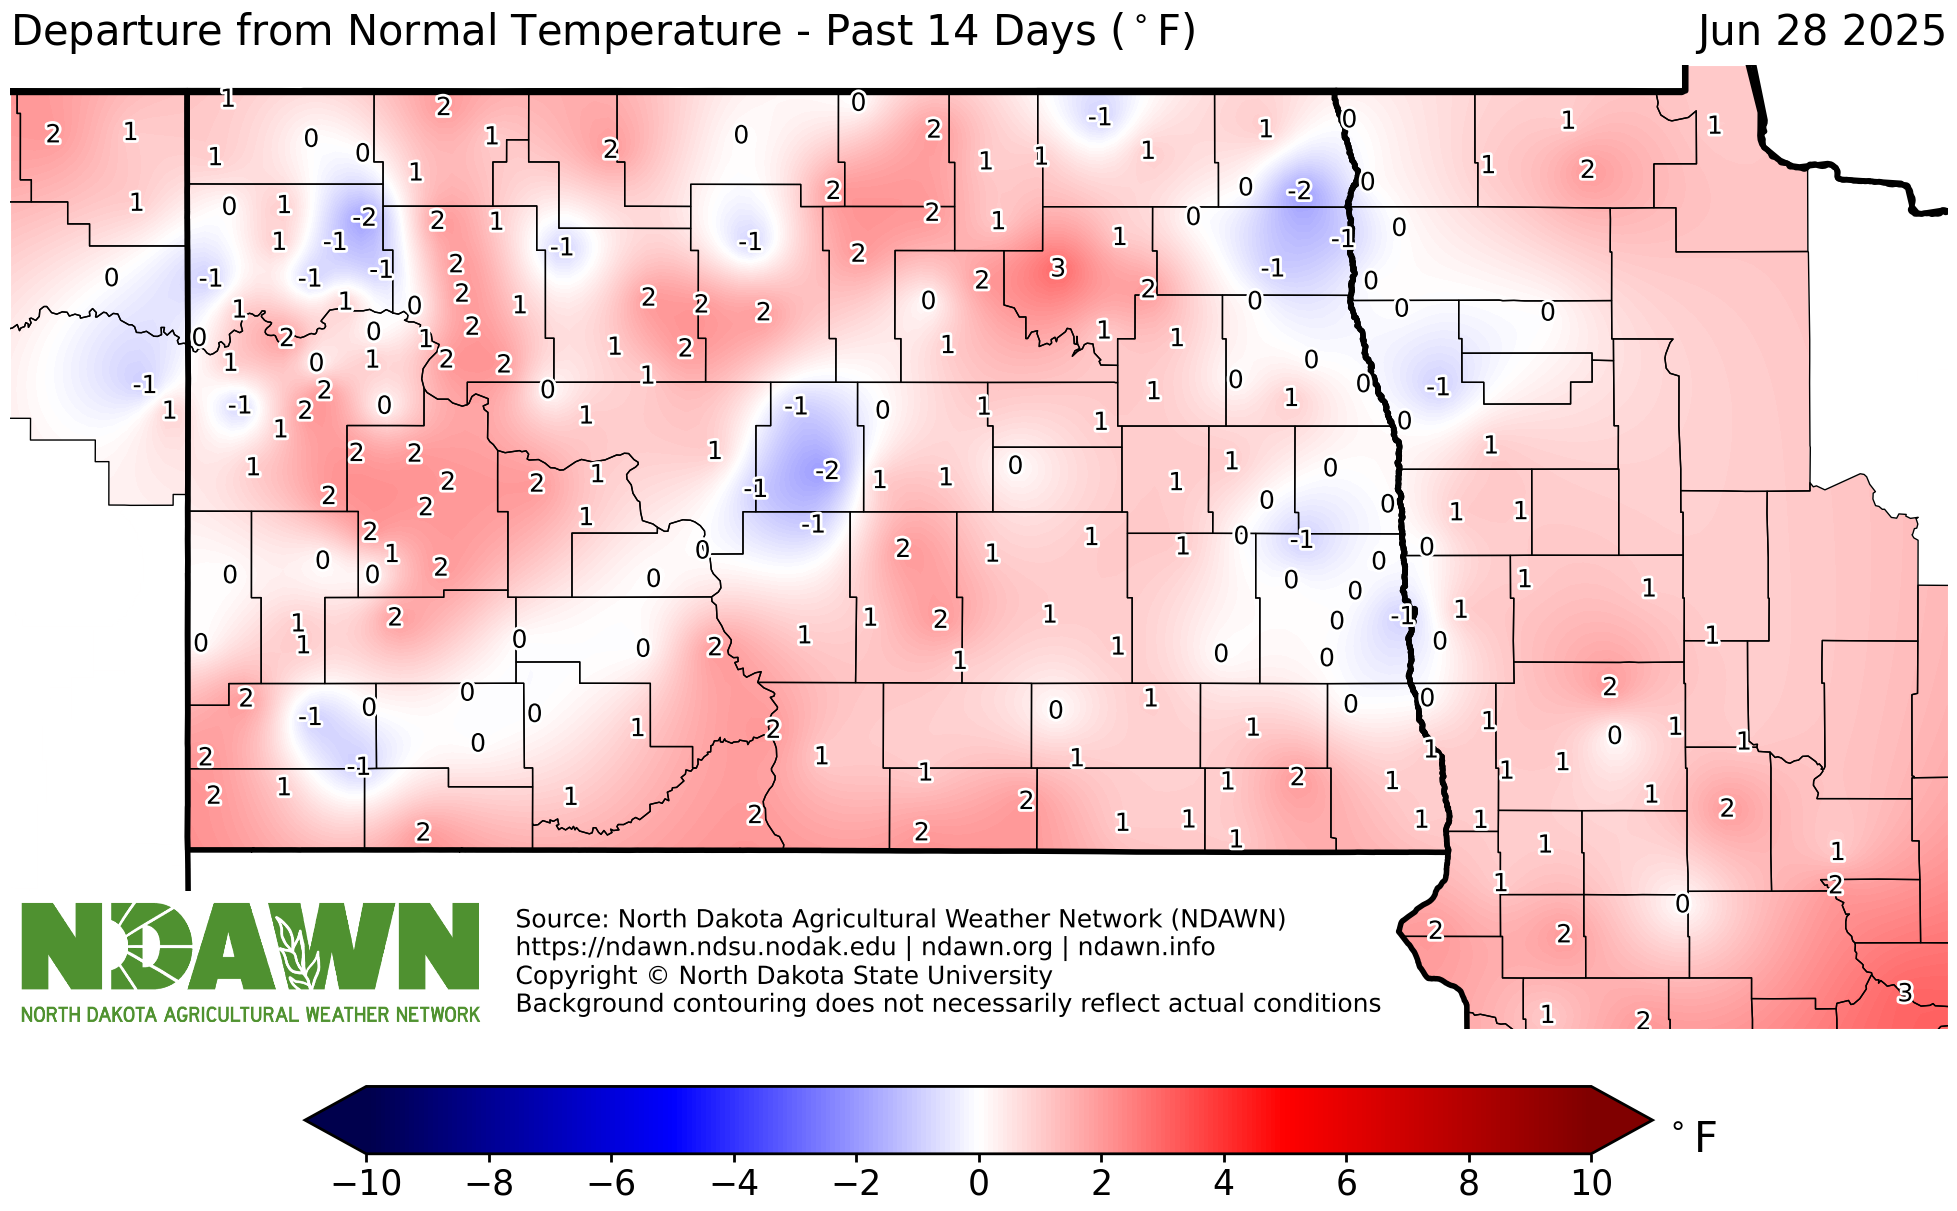
Departure from Normal Temperature - Past 14 Days
View Larger Image
Departure from Normal Temperature - Past 30 Days
View Larger Image
Departure from Normal Temperature - Past 60 Days
View Larger Image
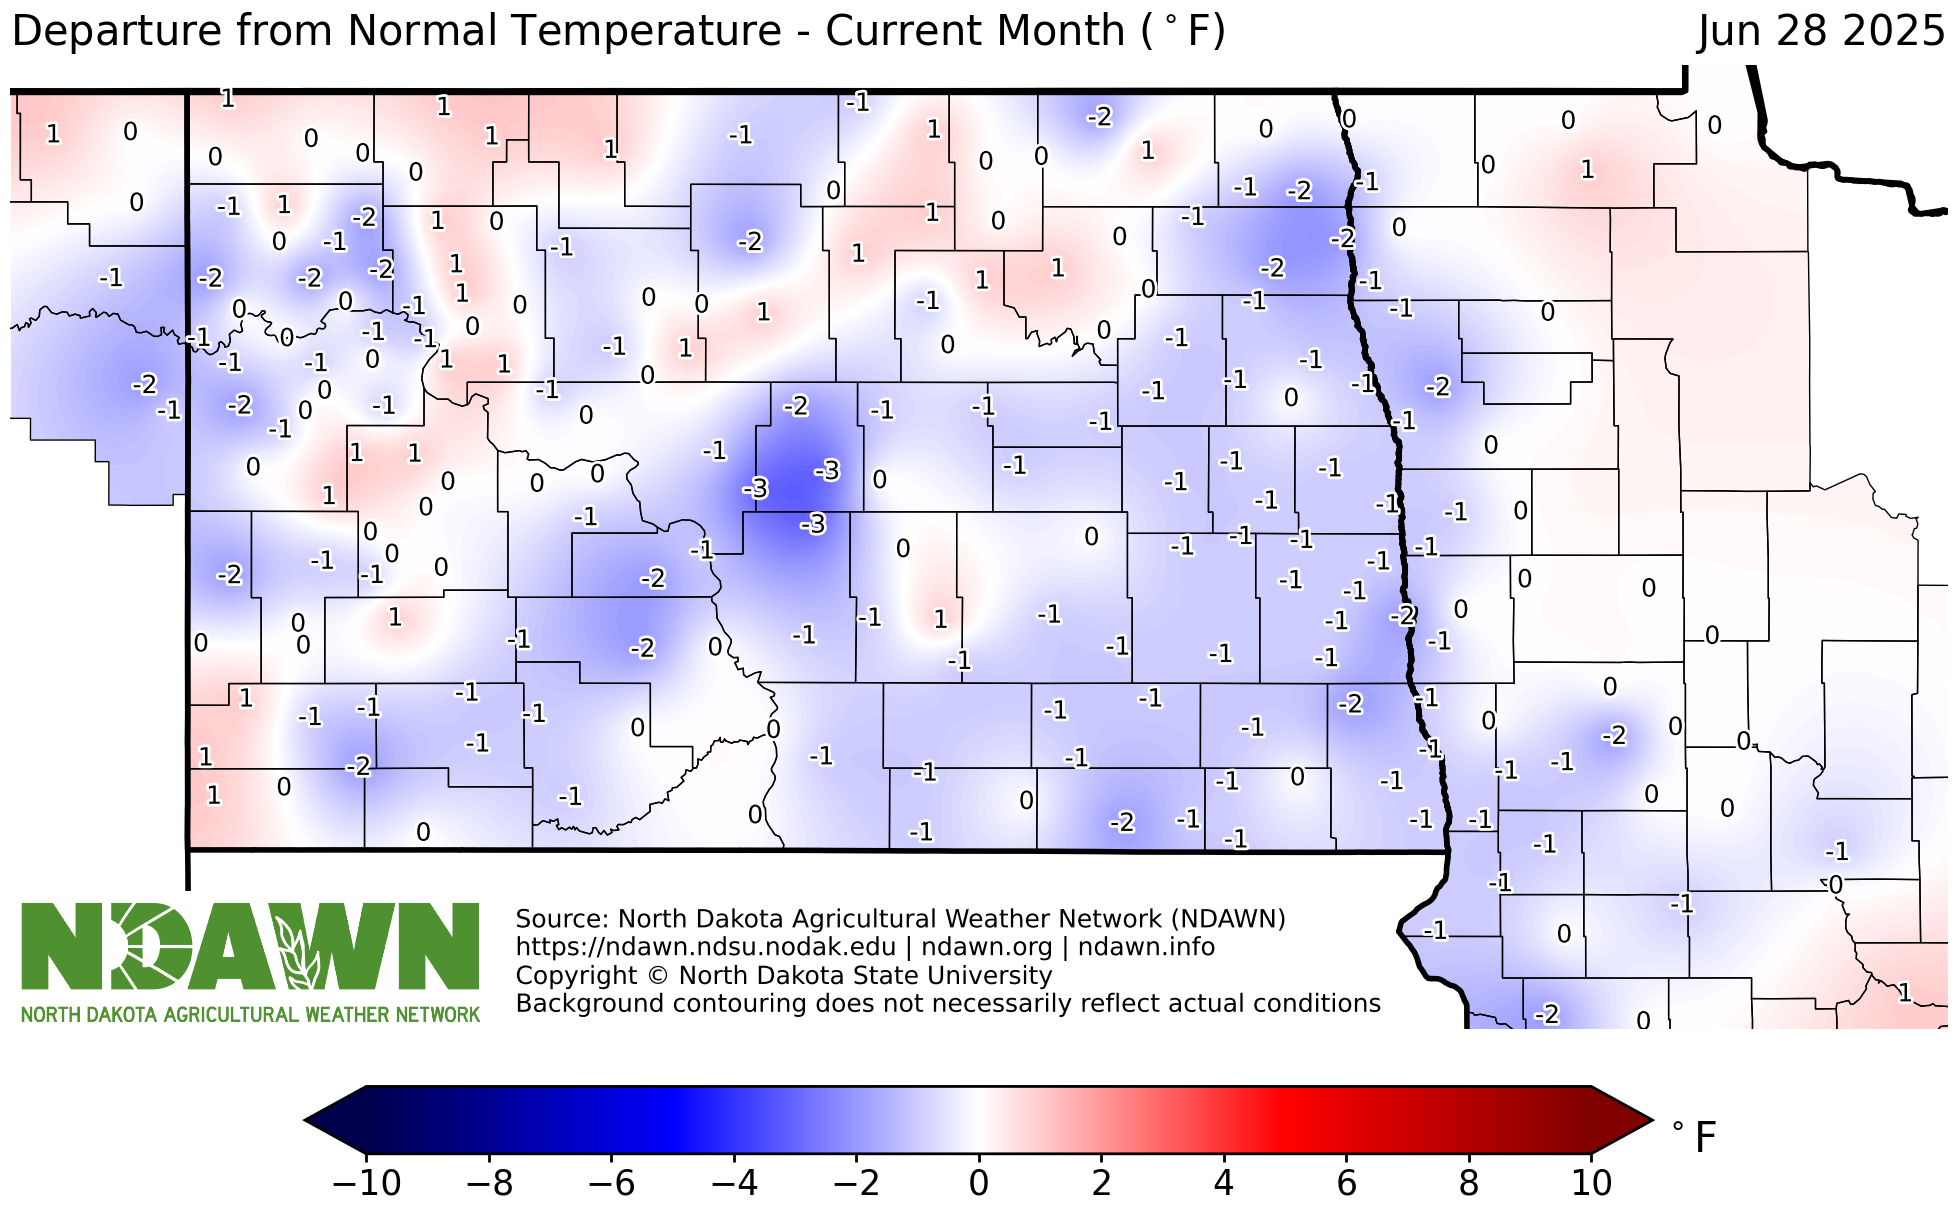
Departure from Normal Temperature - Current Month
View Larger Image
Departure from Normal Temperature - Since January 1, 2026
View Larger Image
Departure from Normal Temperature - Since May 1, 2026
View Larger Image
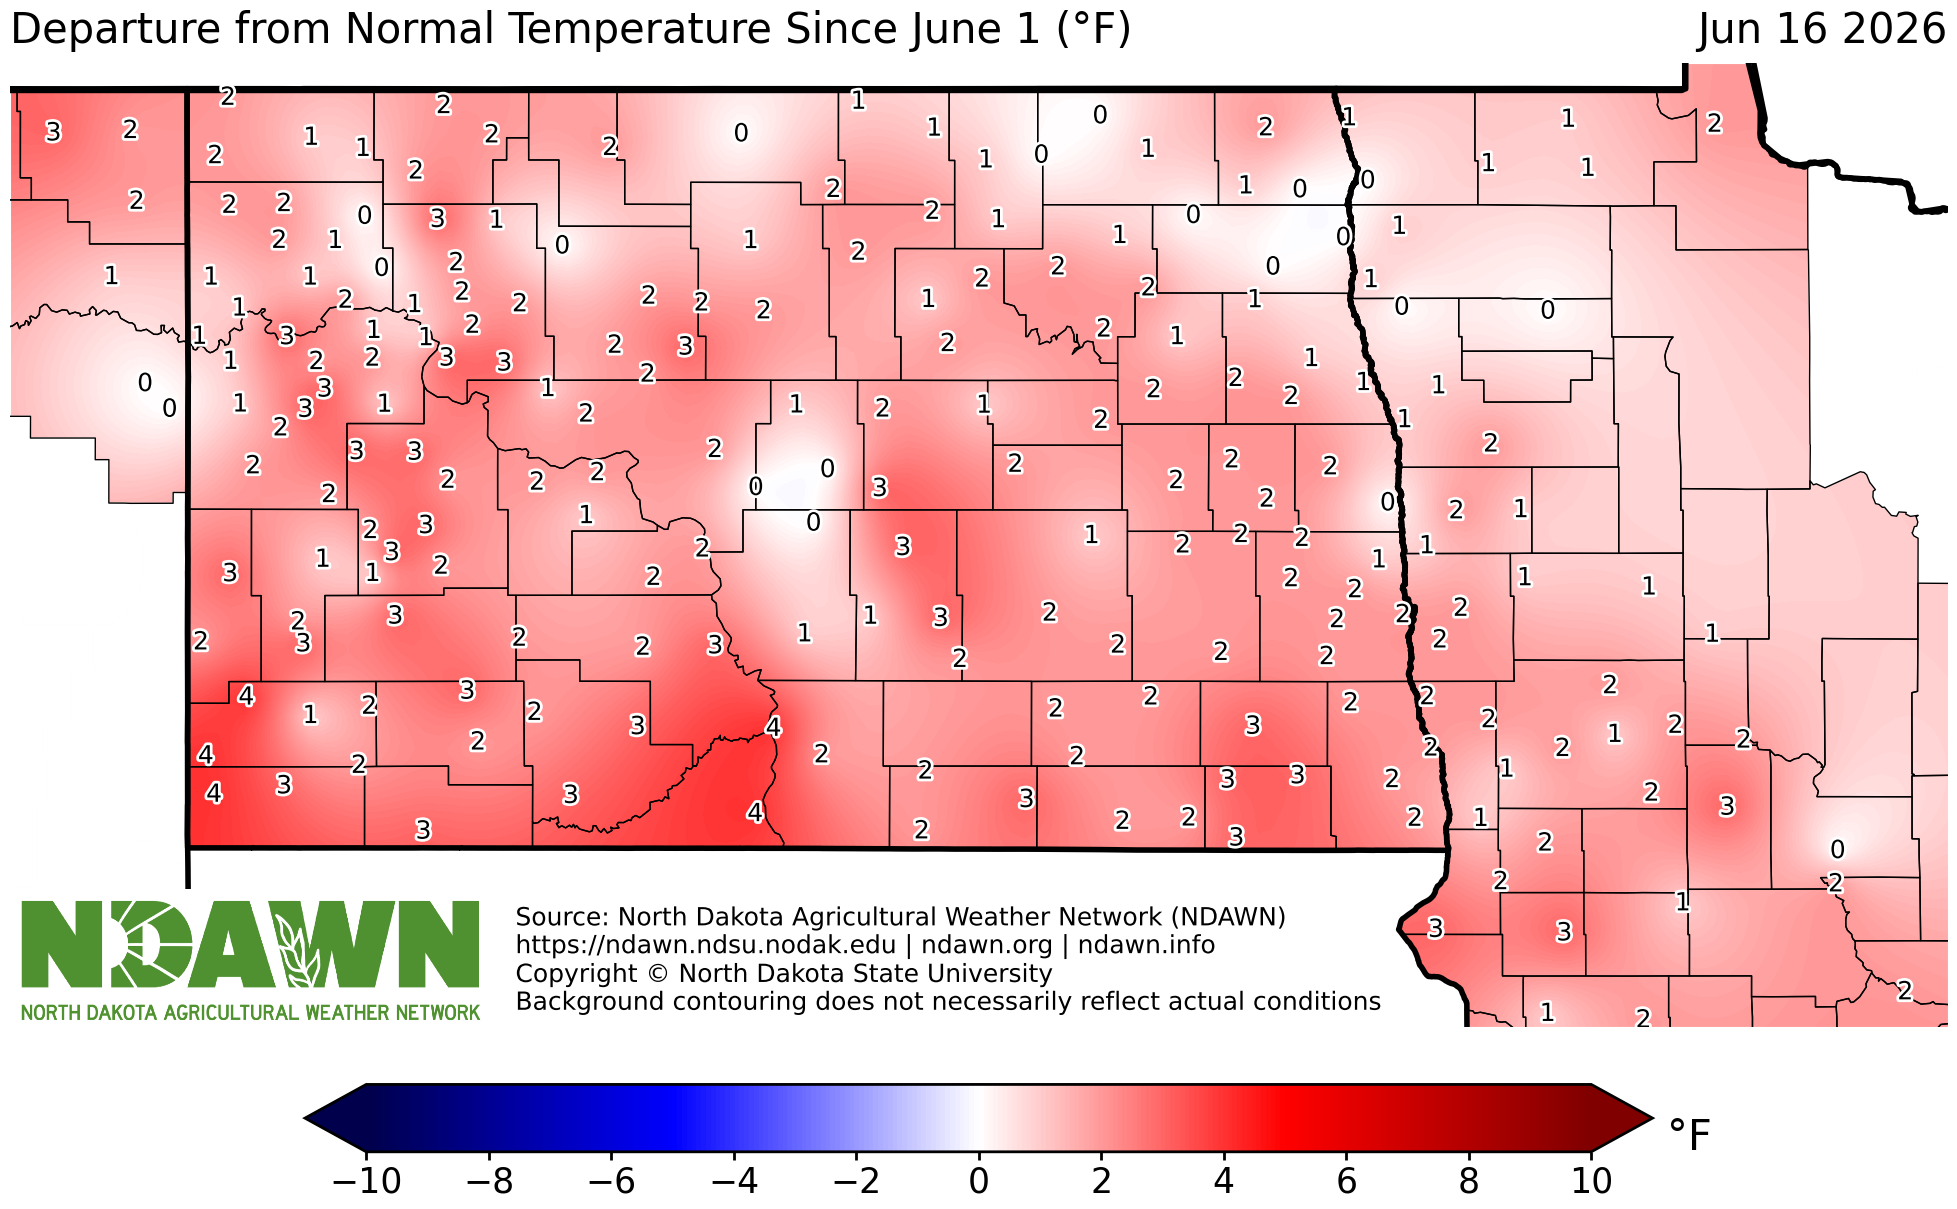
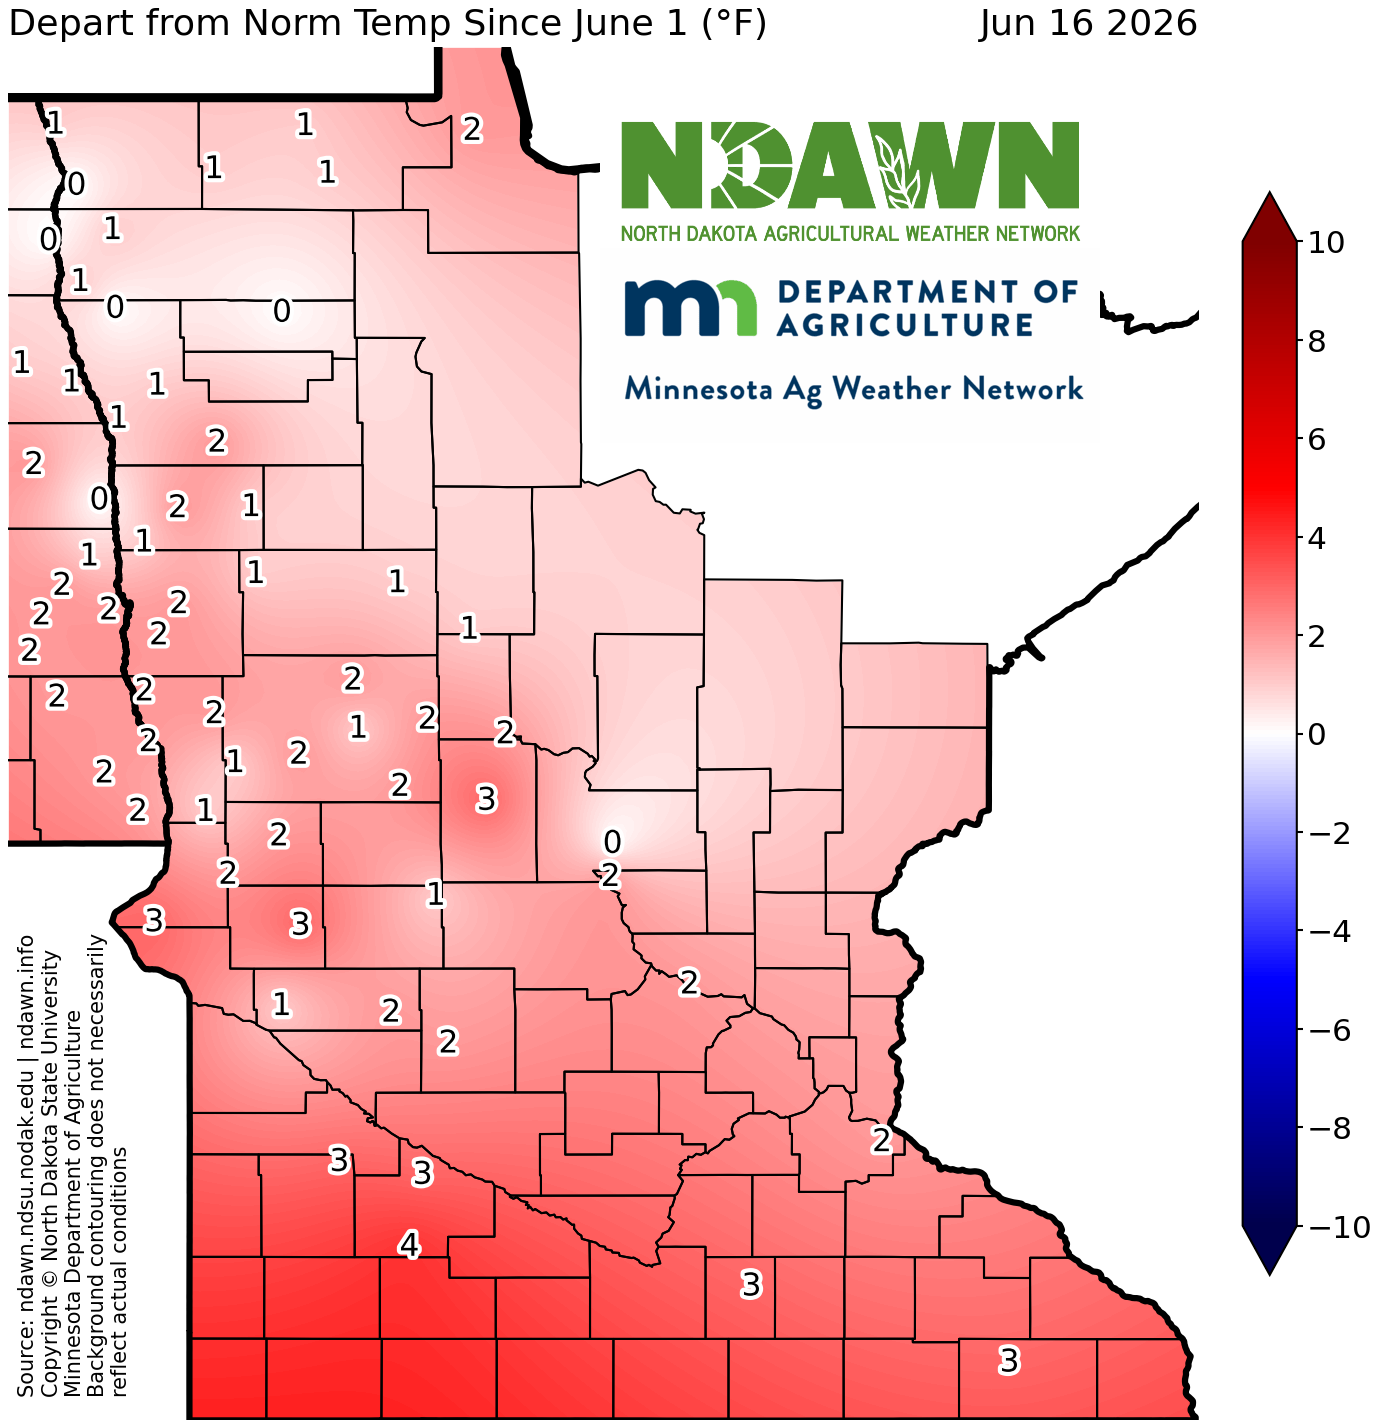
Departure from Normal Temperature - Since June 1, 2026
View Larger Image
Average Maximum Temperatures
Average Max Temperature - Past 3 Days
View Larger Image
Average Max Temperature - Past 5 Days
View Larger Image
Average Max Temperature - Past 7 Days
View Larger Image
Average Max Temperature - Past 10 Days
View Larger Image
Average Max Temperature - Past 14 Days
View Larger Image
Average Max Temperature - Past 30 Days
View Larger Image
Average Max Temperature - Past 60 Days
View Larger Image
Average Max Temperature - Current Month
View Larger Image
Average Max Temperature - Since January 1, 2026
View Larger Image
Average Max Temperature - Since May 1, 2026
View Larger Image
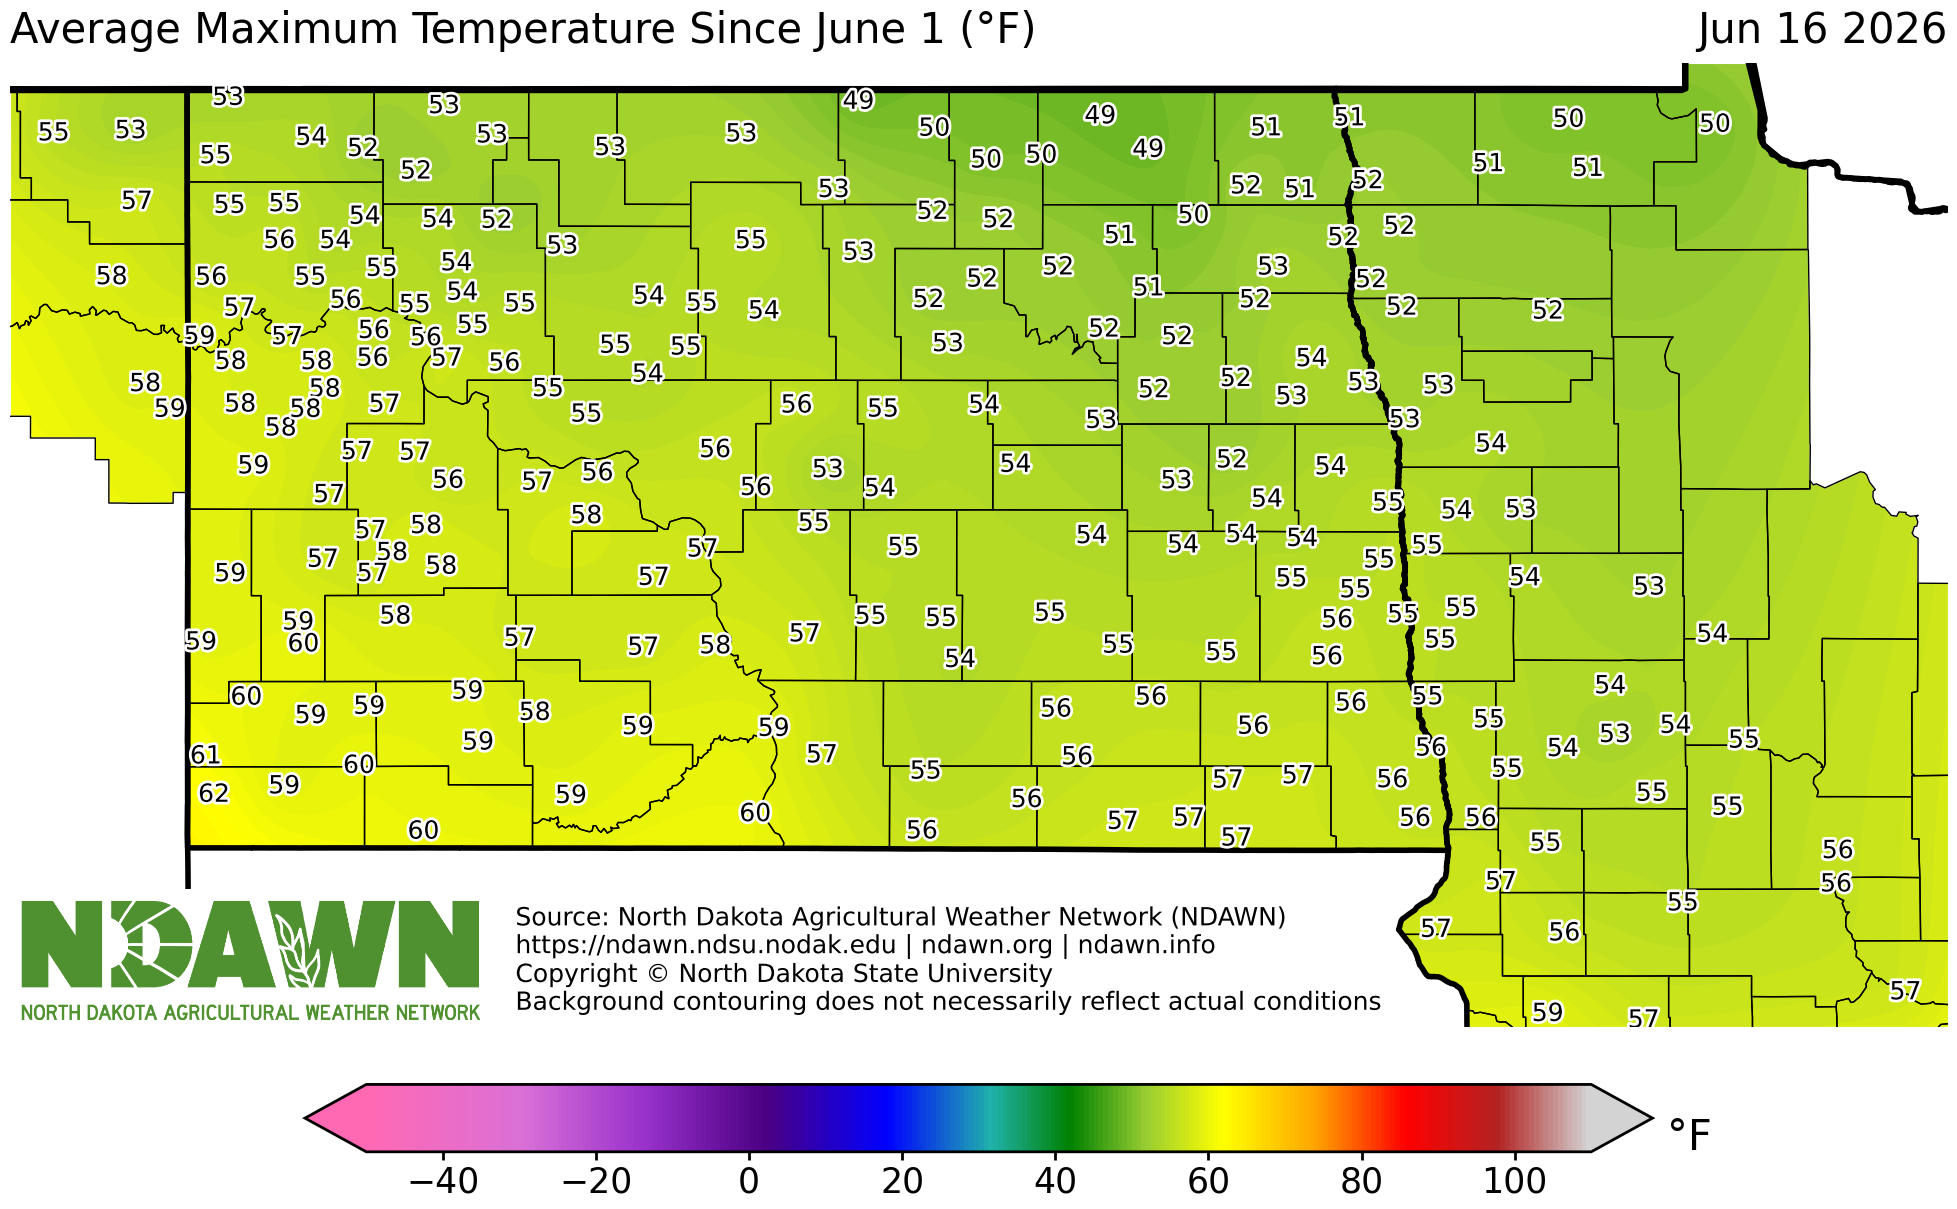
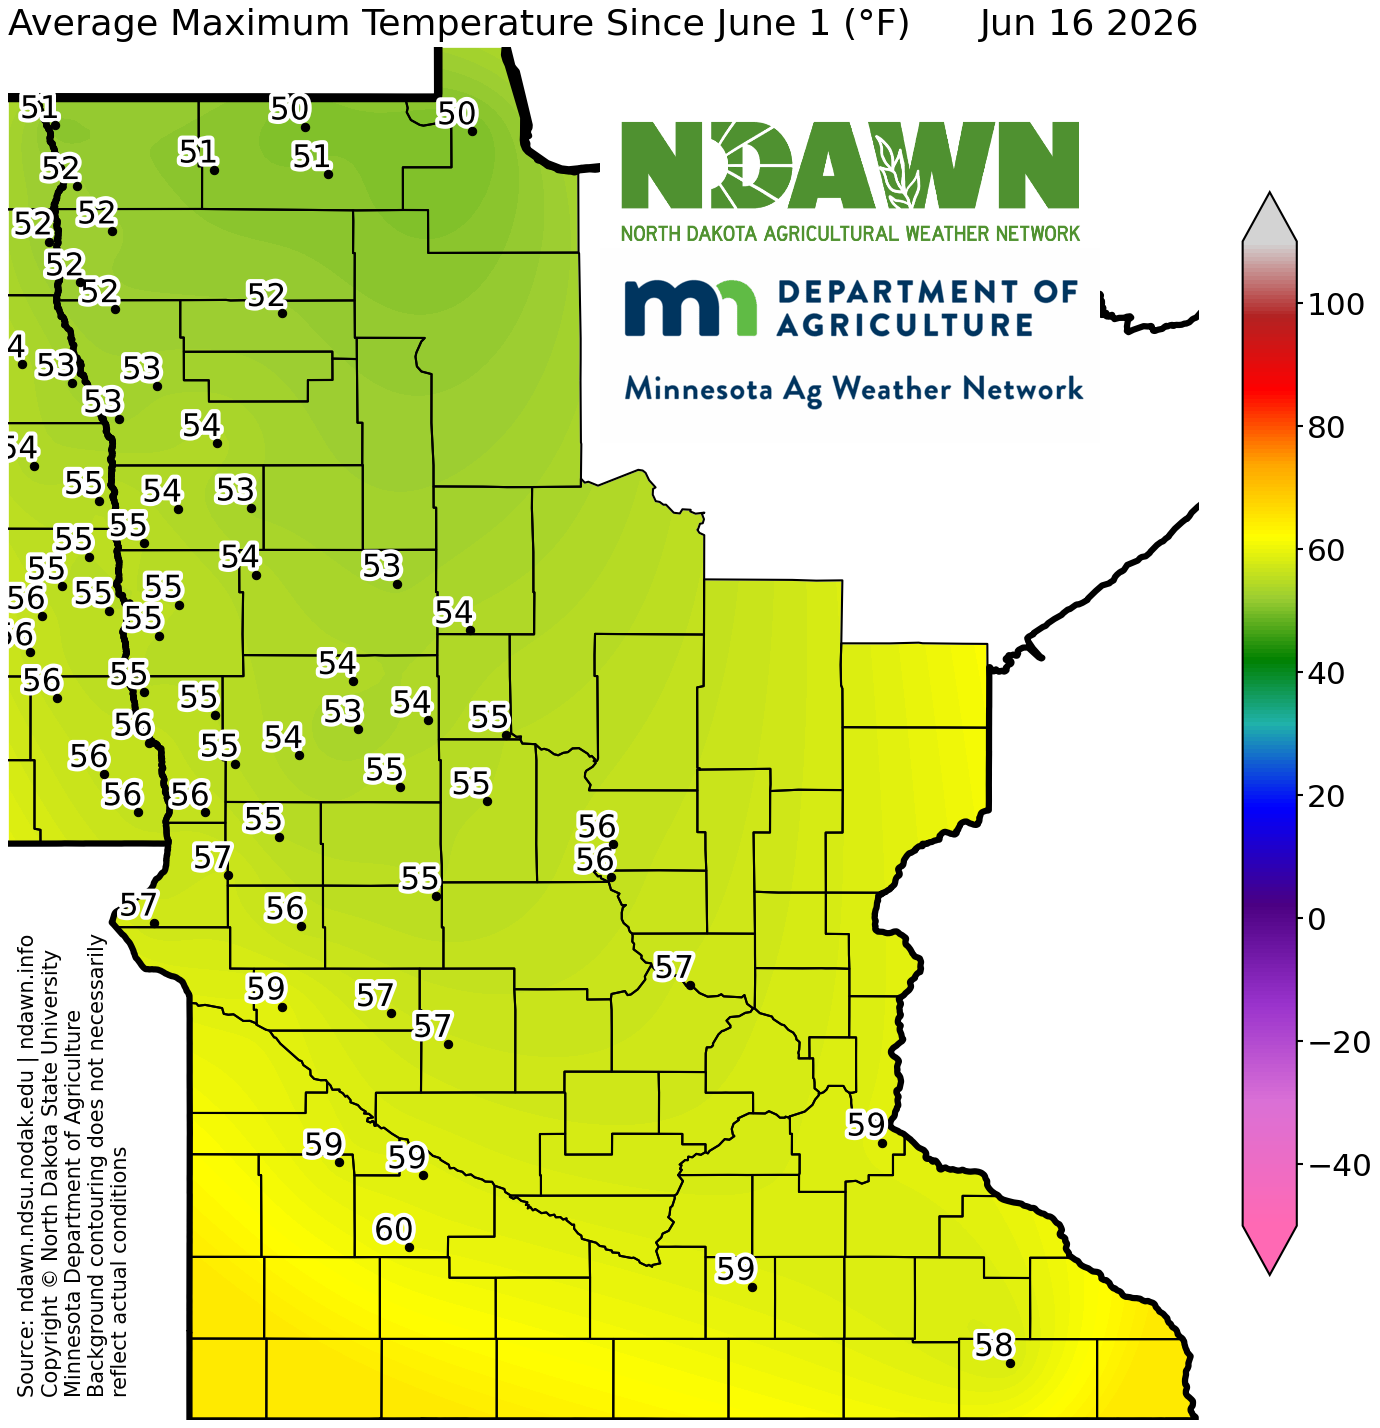
Average Max Temperature - Since June 1, 2026
View Larger Image
Departure from Normal Maximum Temperature
Departure from Normal Max Temperature - Past 3 Days
View Larger Image
Departure from Normal Max Temperature - Past 5 Days
View Larger Image
Departure from Normal Max Temperature - Past 7 Days
View Larger Image
Departure from Normal Max Temperature - Past 10 Days
View Larger Image
Departure from Normal Max Temperature - Past 14 Days
View Larger Image
Departure from Normal Max Temperature - Past 30 Days
View Larger Image
Departure from Normal Max Temperature - Past 60 Days
View Larger Image
Departure from Normal Max Temperature - Current Month
View Larger Image
Departure from Normal Max Temperature - Since January 1, 2026
View Larger Image
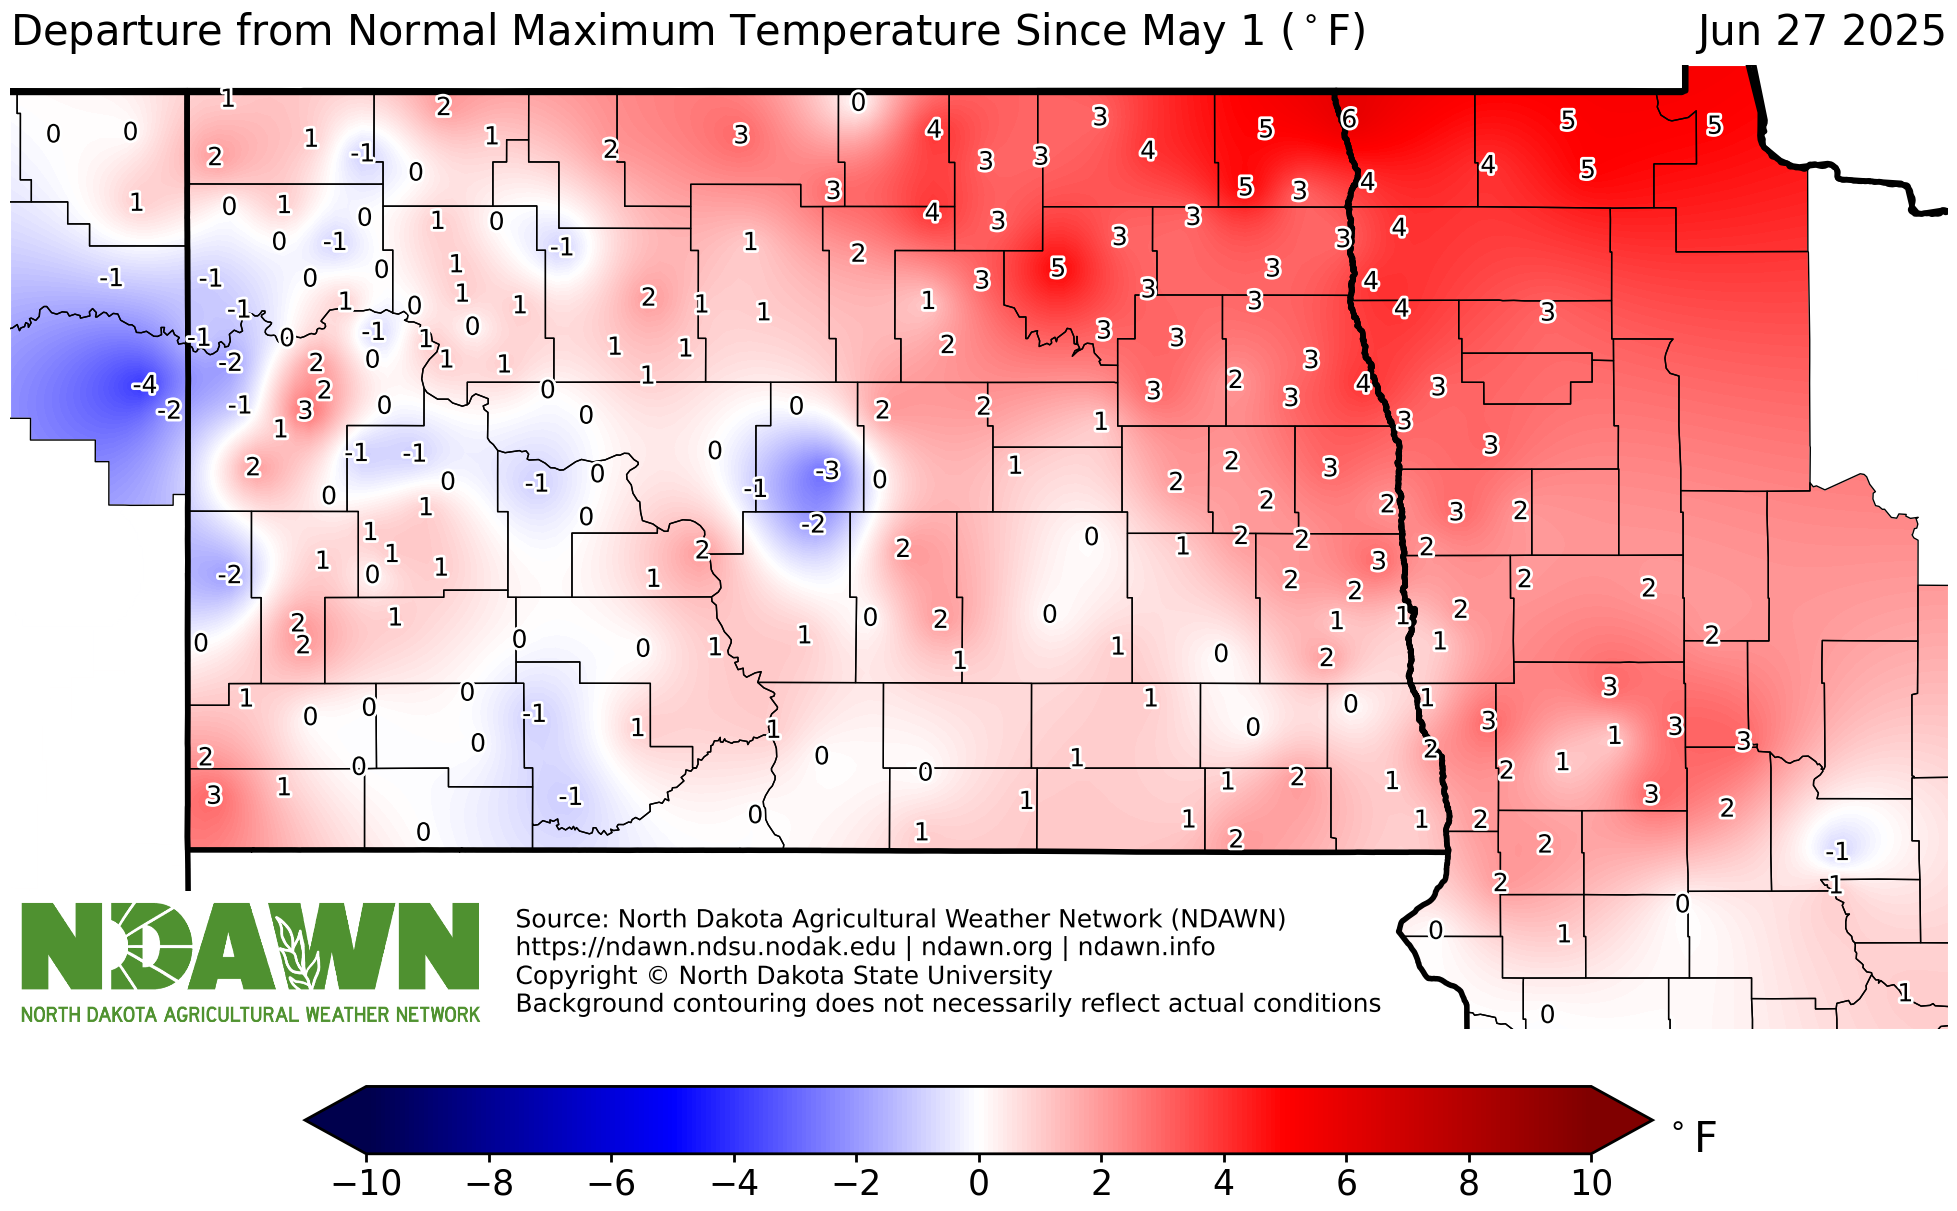
Departure from Normal Max Temperature - Since May 1, 2026
View Larger Image
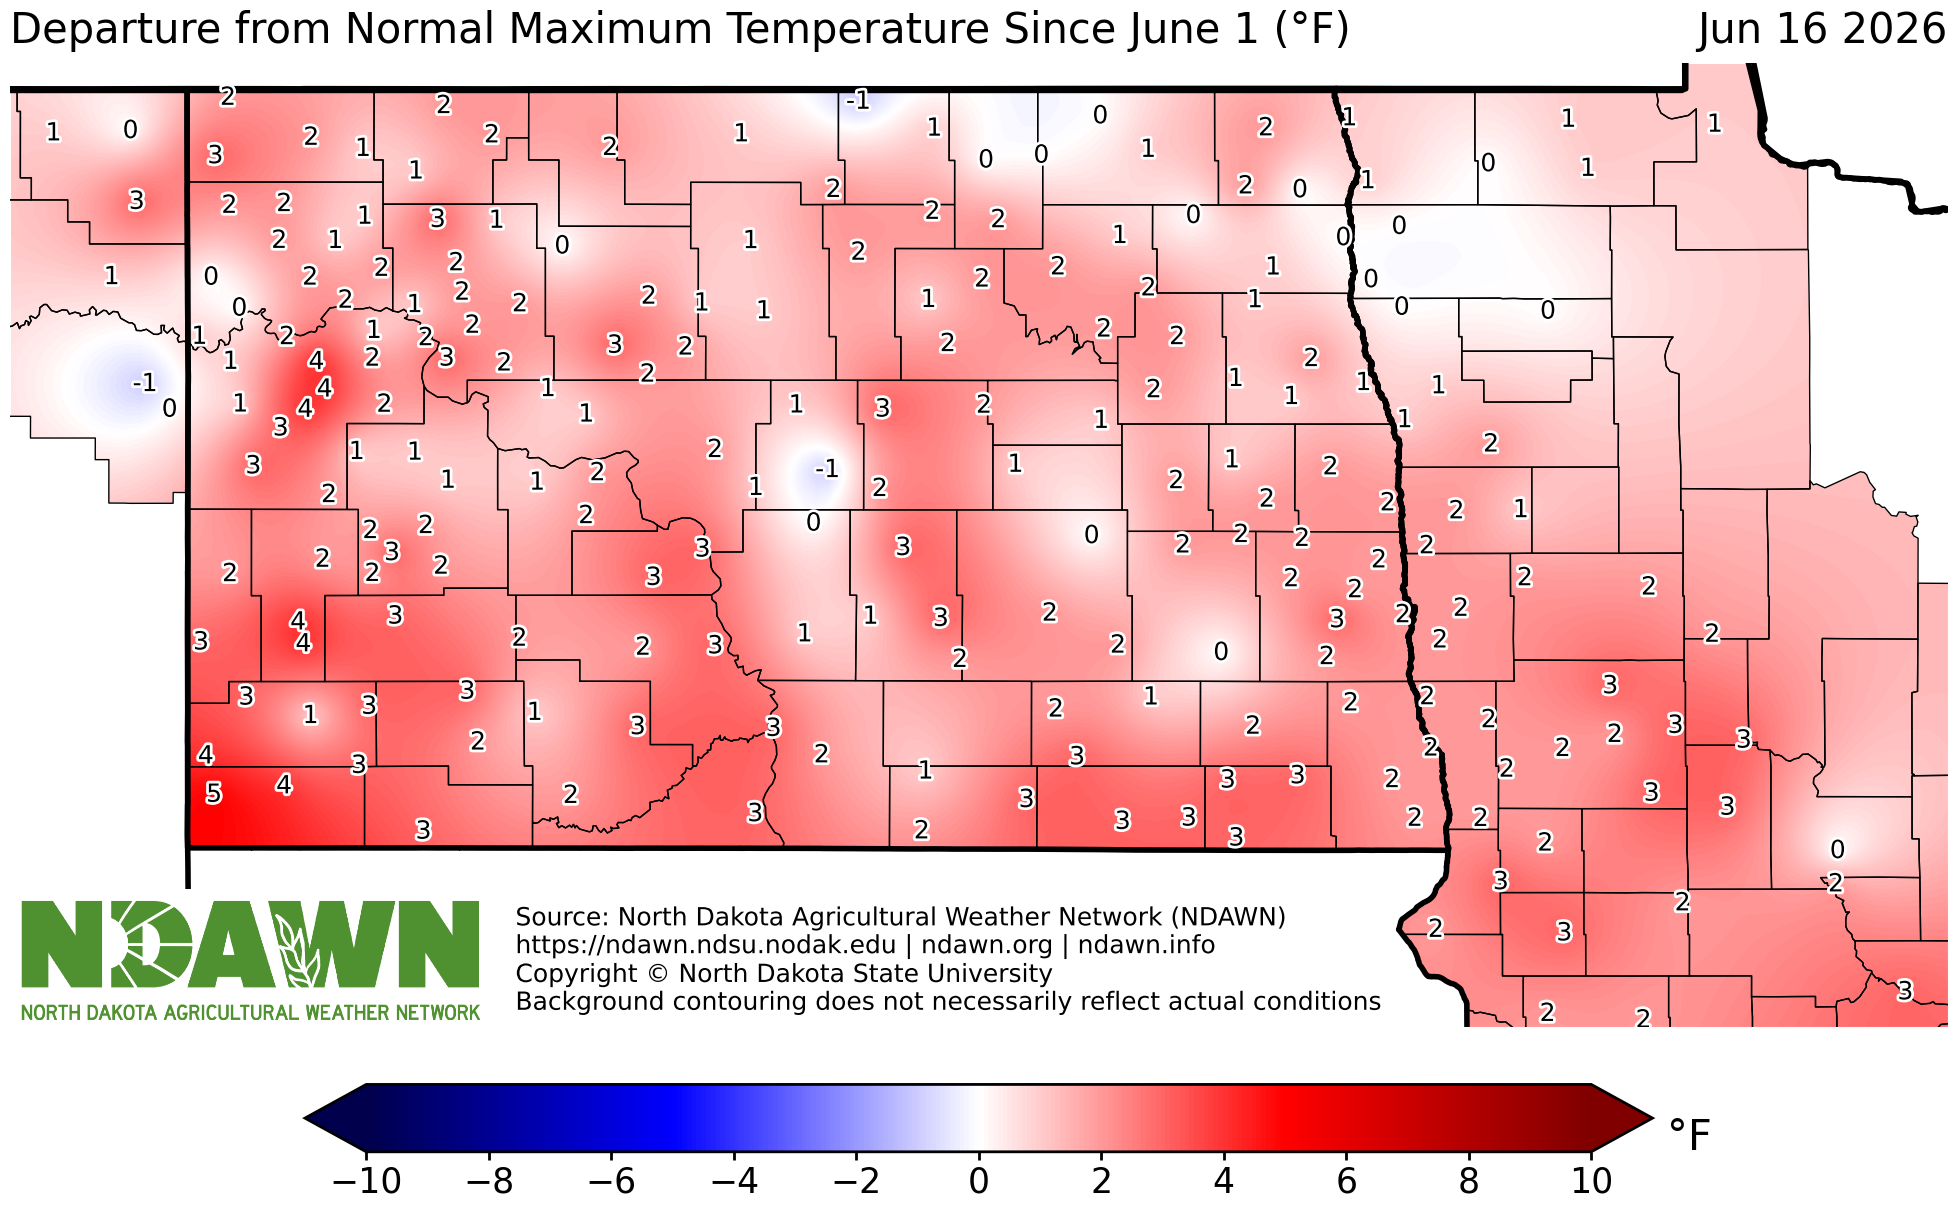
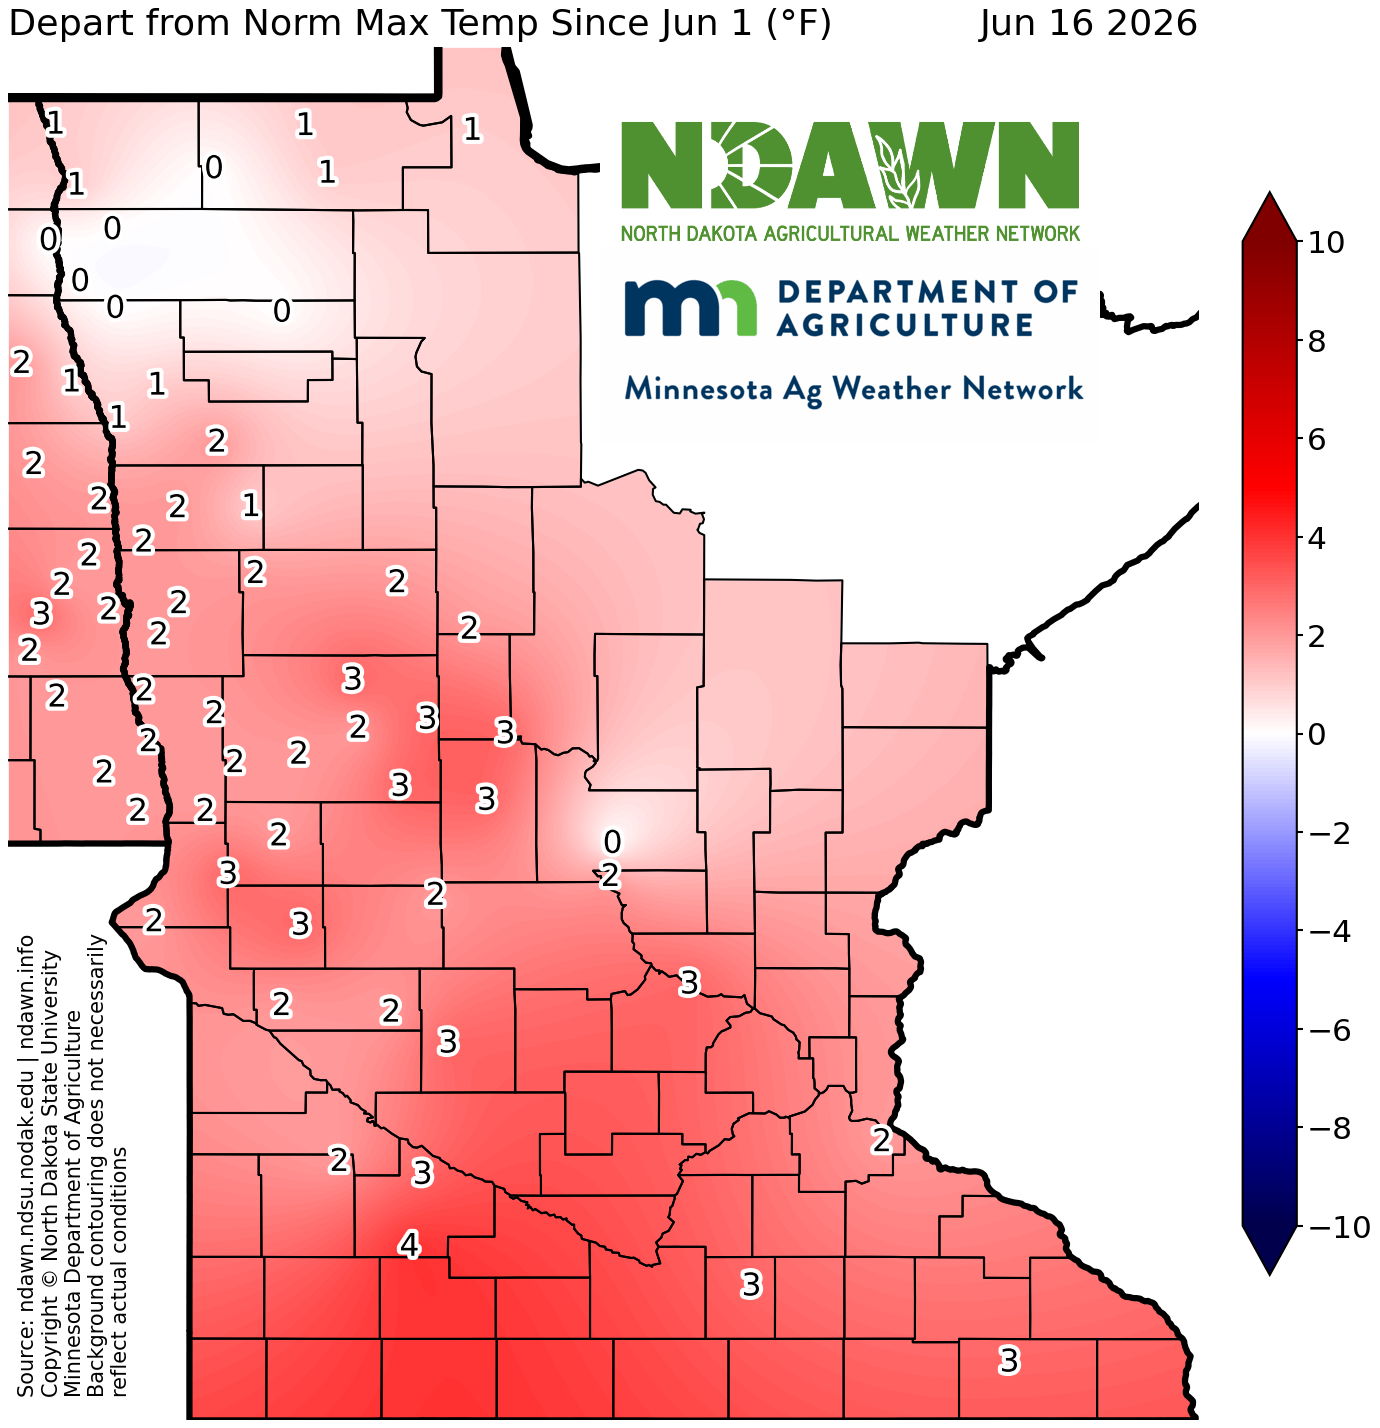
Departure from Normal Max Temperature - Since June 1, 2026
View Larger Image
Average Minimum Temperatures
Average Min Temperature - Past 3 Days
View Larger Image
Average Min Temperature - Past 5 Days
View Larger Image
Average Min Temperature - Past 7 Days
View Larger Image
Average Min Temperature - Past 10 Days
View Larger Image
Average Min Temperature - Past 14 Days
View Larger Image
Average Min Temperature - Past 30 Days
View Larger Image
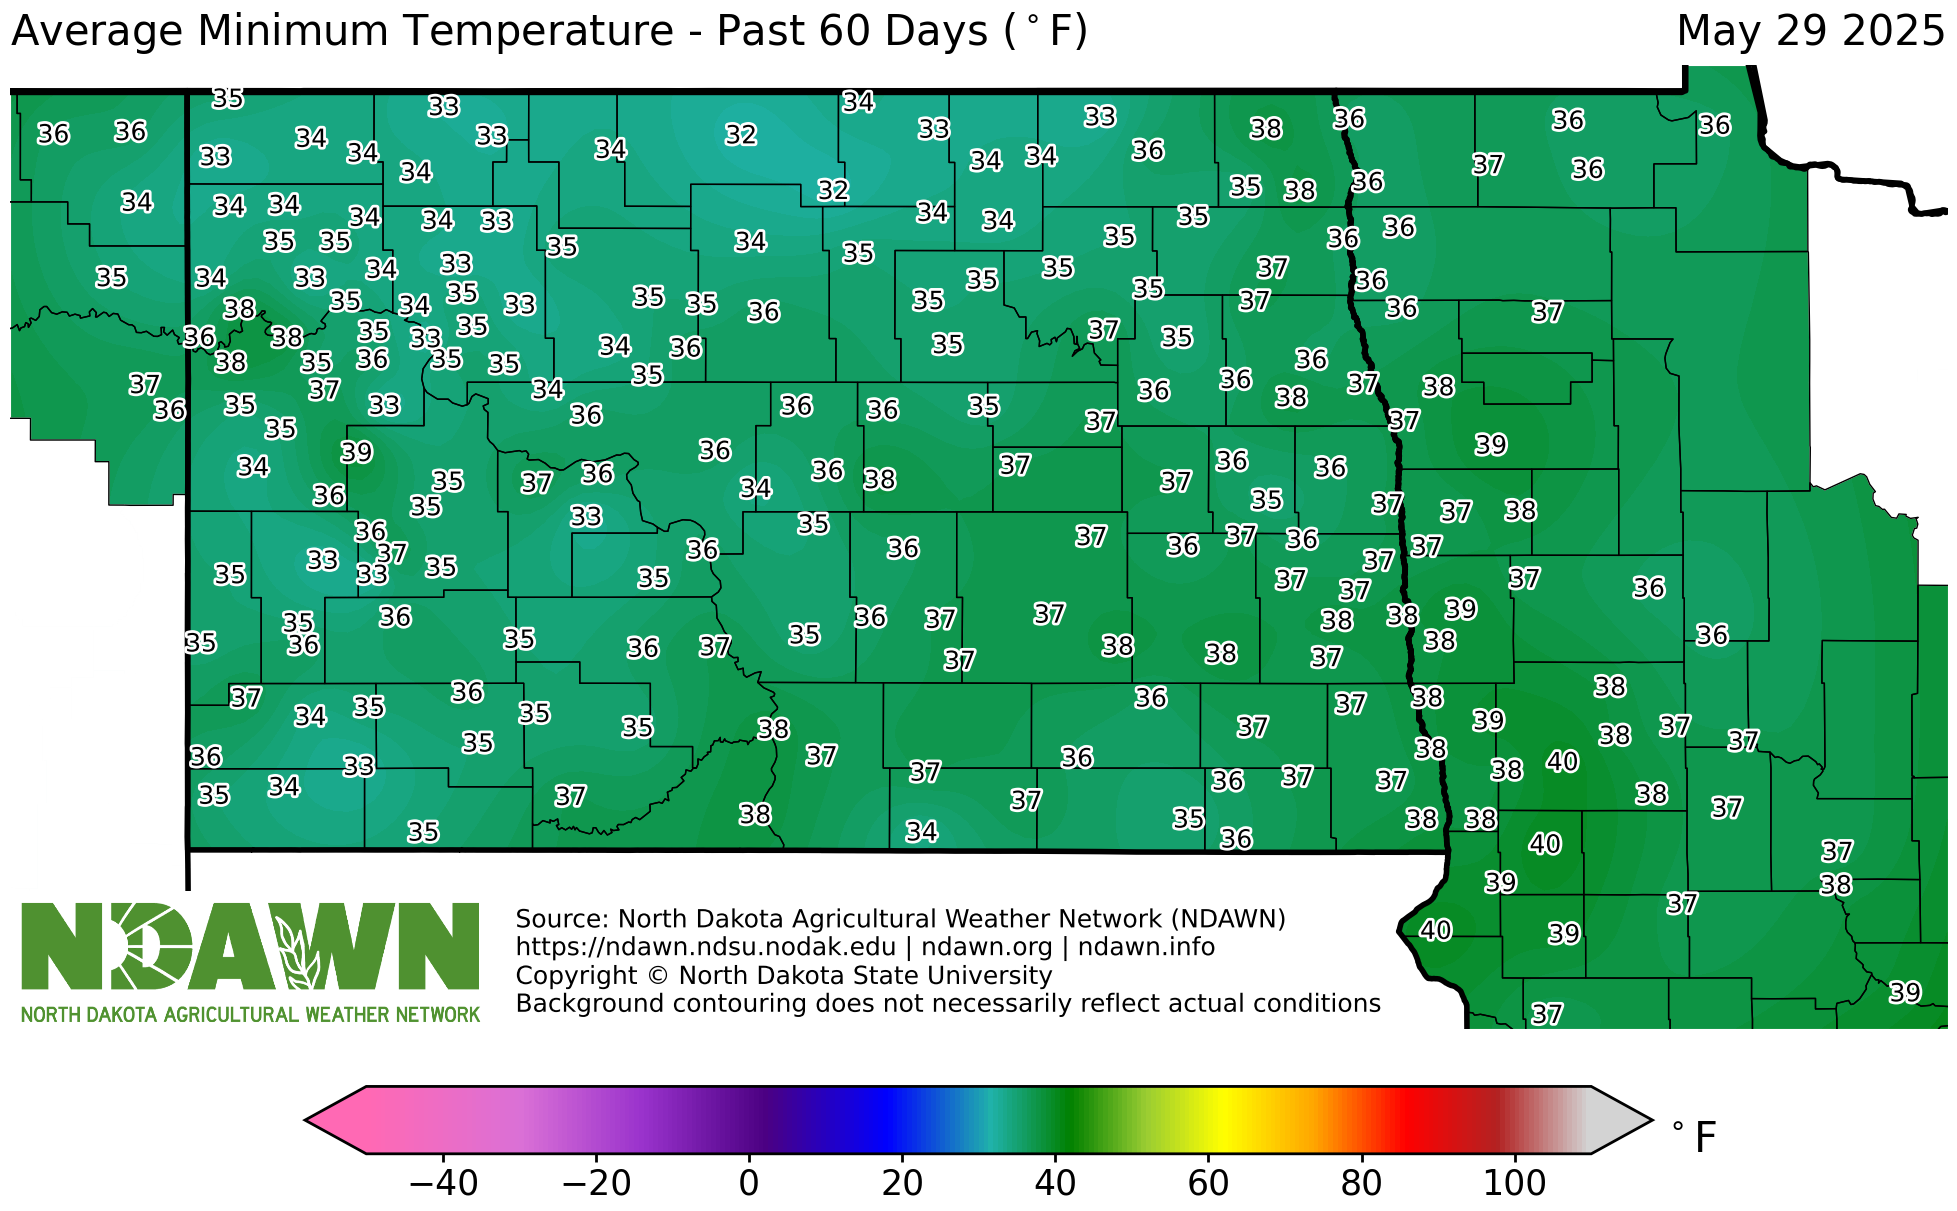
Average Min Temperature - Past 60 Days
View Larger Image
Average Min Temperature - Current Month
View Larger Image
Average Min Temperature - Since January 1, 2026
View Larger Image
Average Min Temperature - Since May 1, 2026
View Larger Image
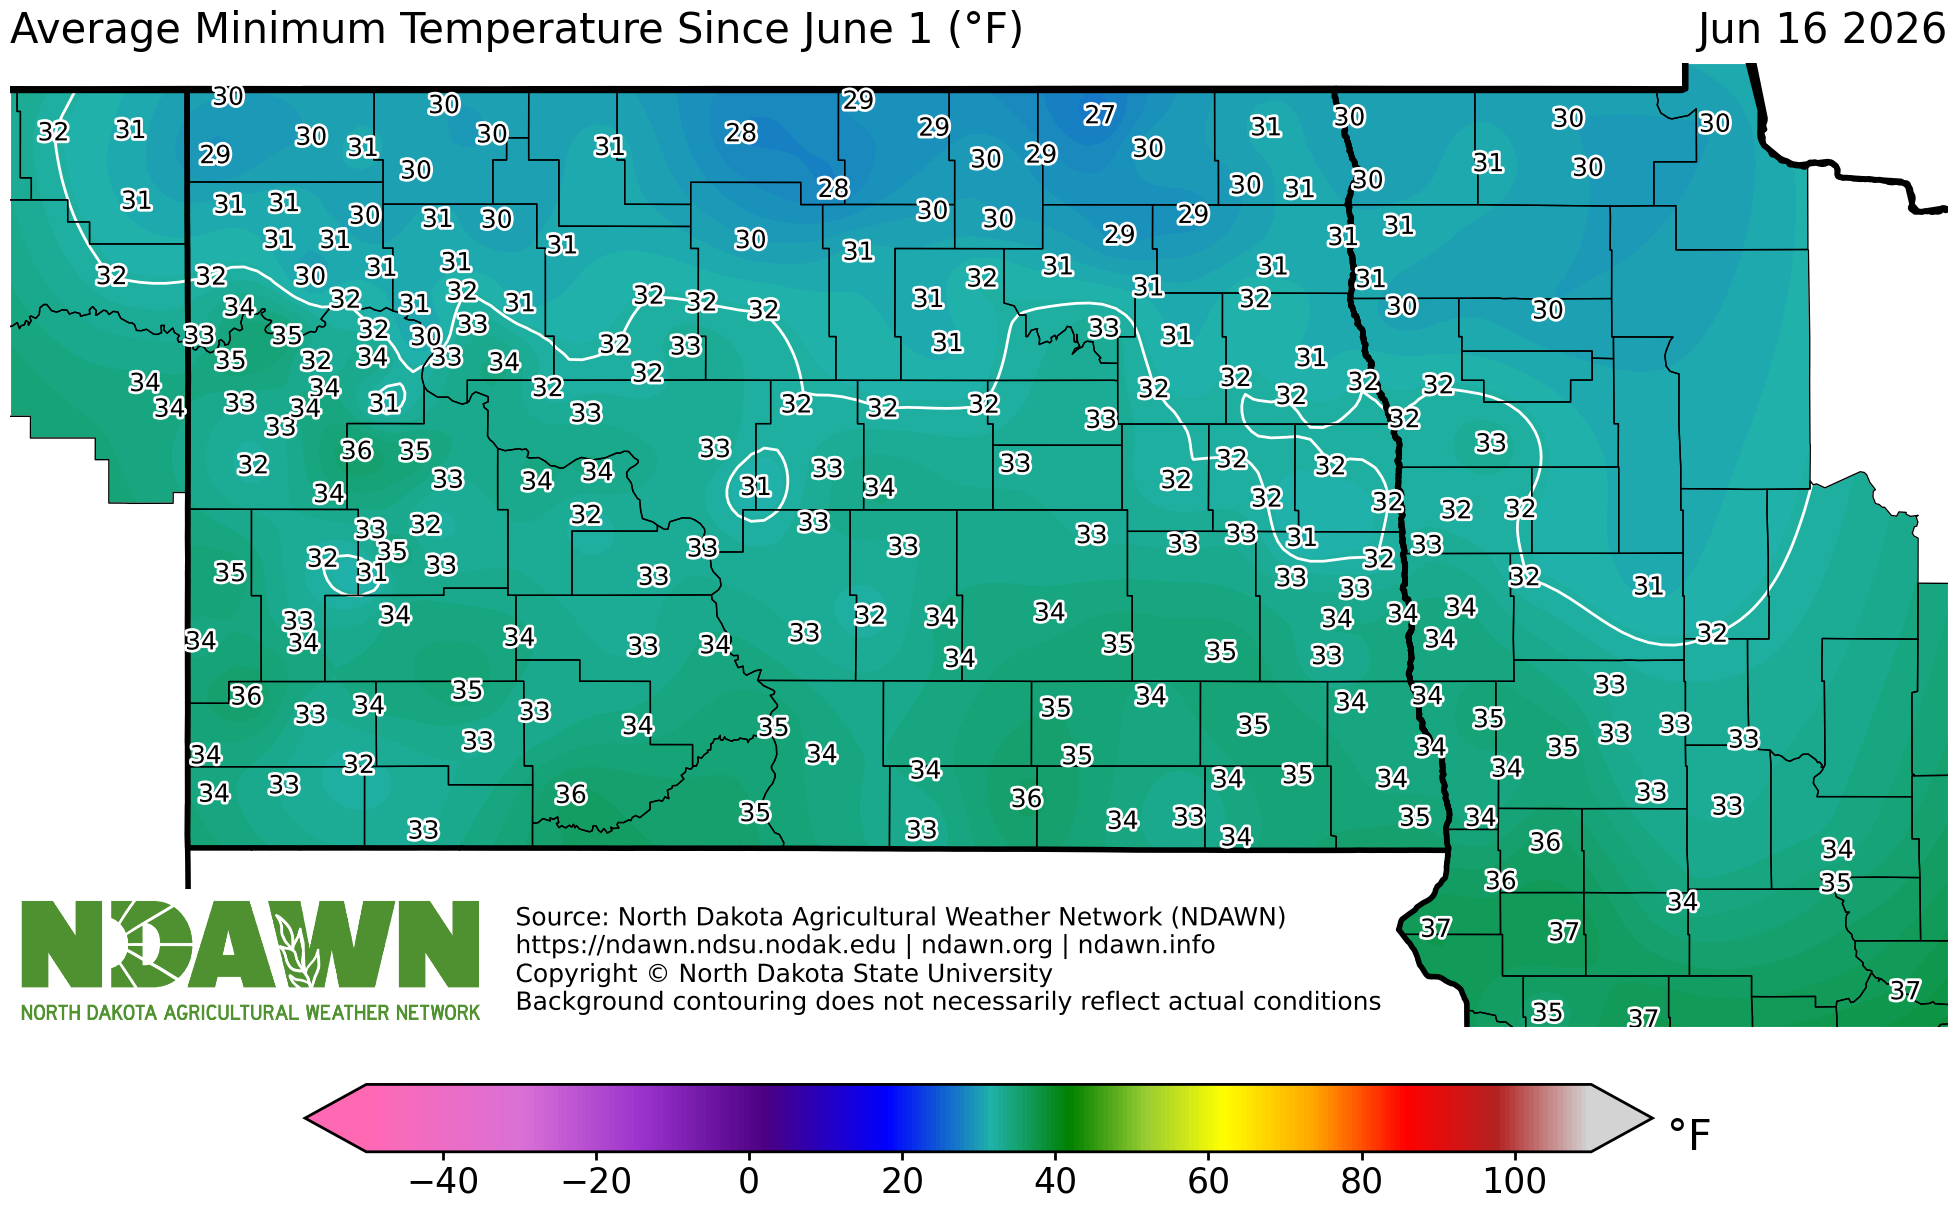
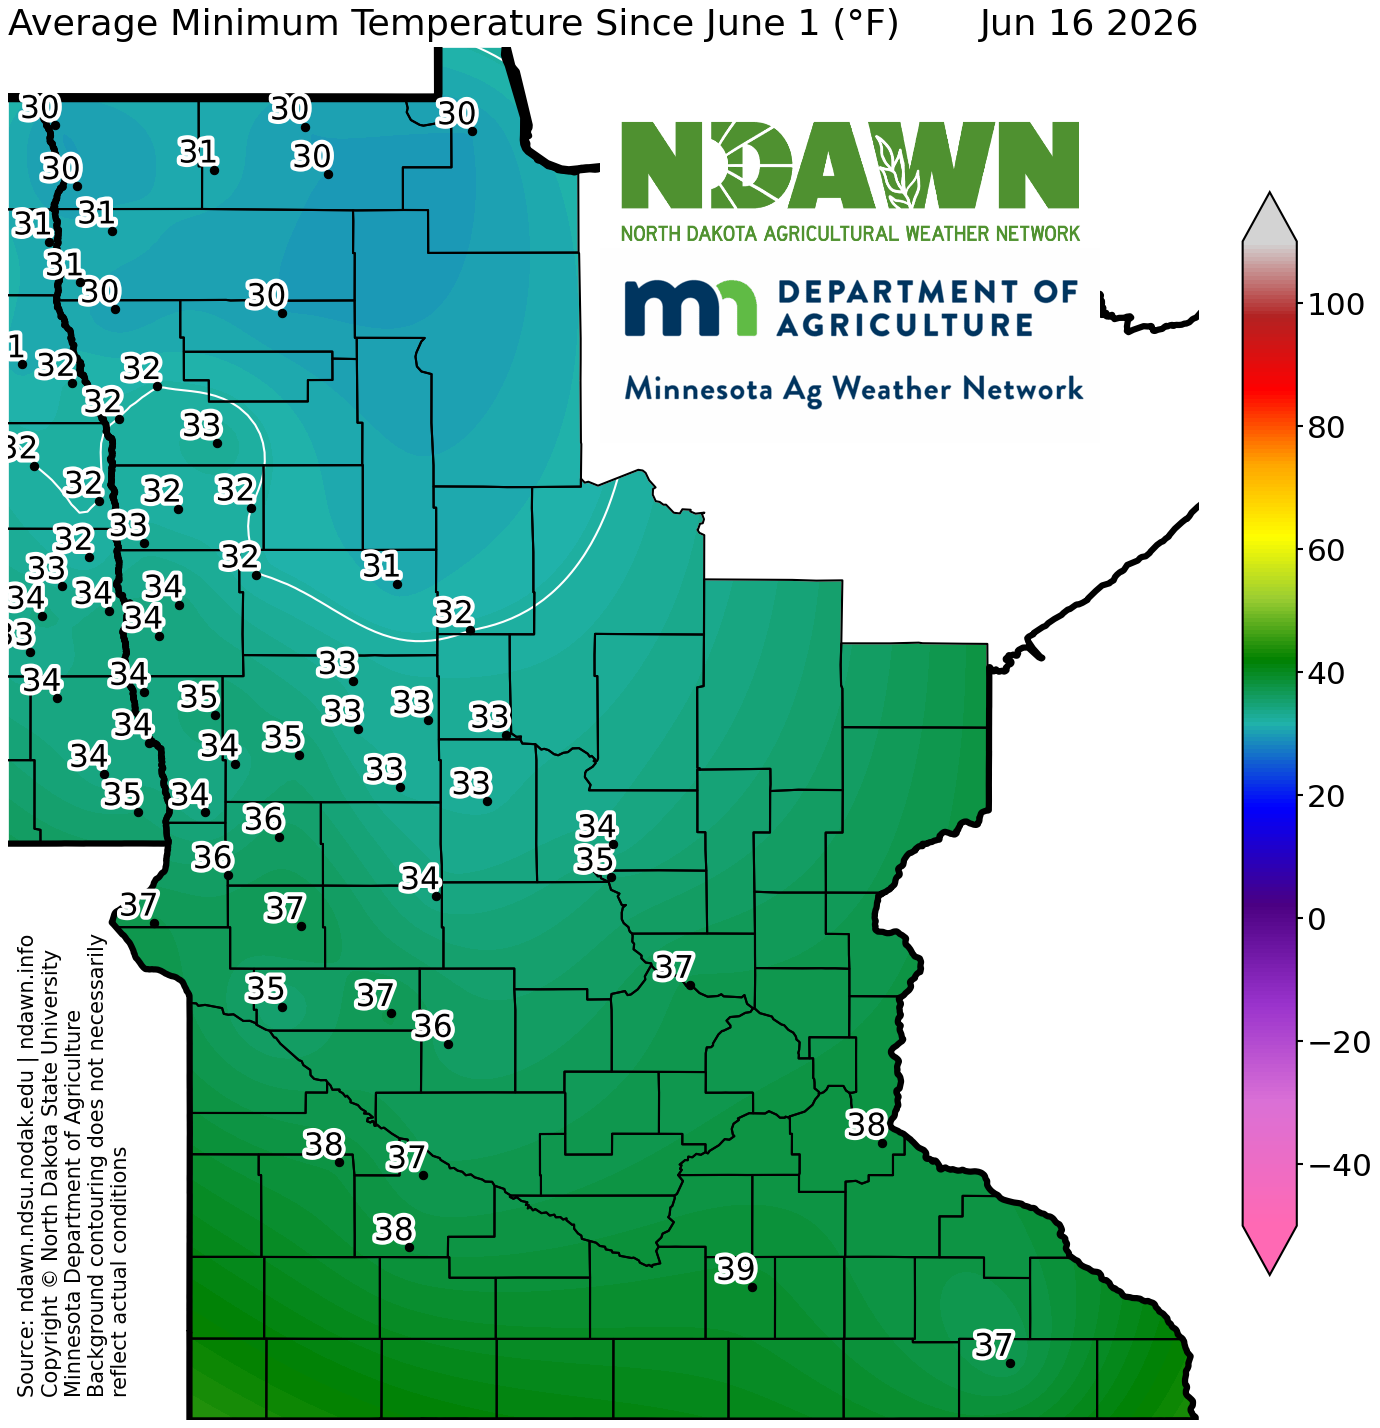
Average Min Temperature - Since June 1, 2026
View Larger Image
Departure from Normal Minimum Temperature
Departure from Normal Min Temperature - Past 3 Days
View Larger Image
Departure from Normal Min Temperature - Past 5 Days
View Larger Image
Departure from Normal Min Temperature - Past 7 Days
View Larger Image
Departure from Normal Min Temperature - Past 10 Days
View Larger Image
Departure from Normal Min Temperature - Past 14 Days
View Larger Image
Departure from Normal Min Temperature - Past 30 Days
View Larger Image
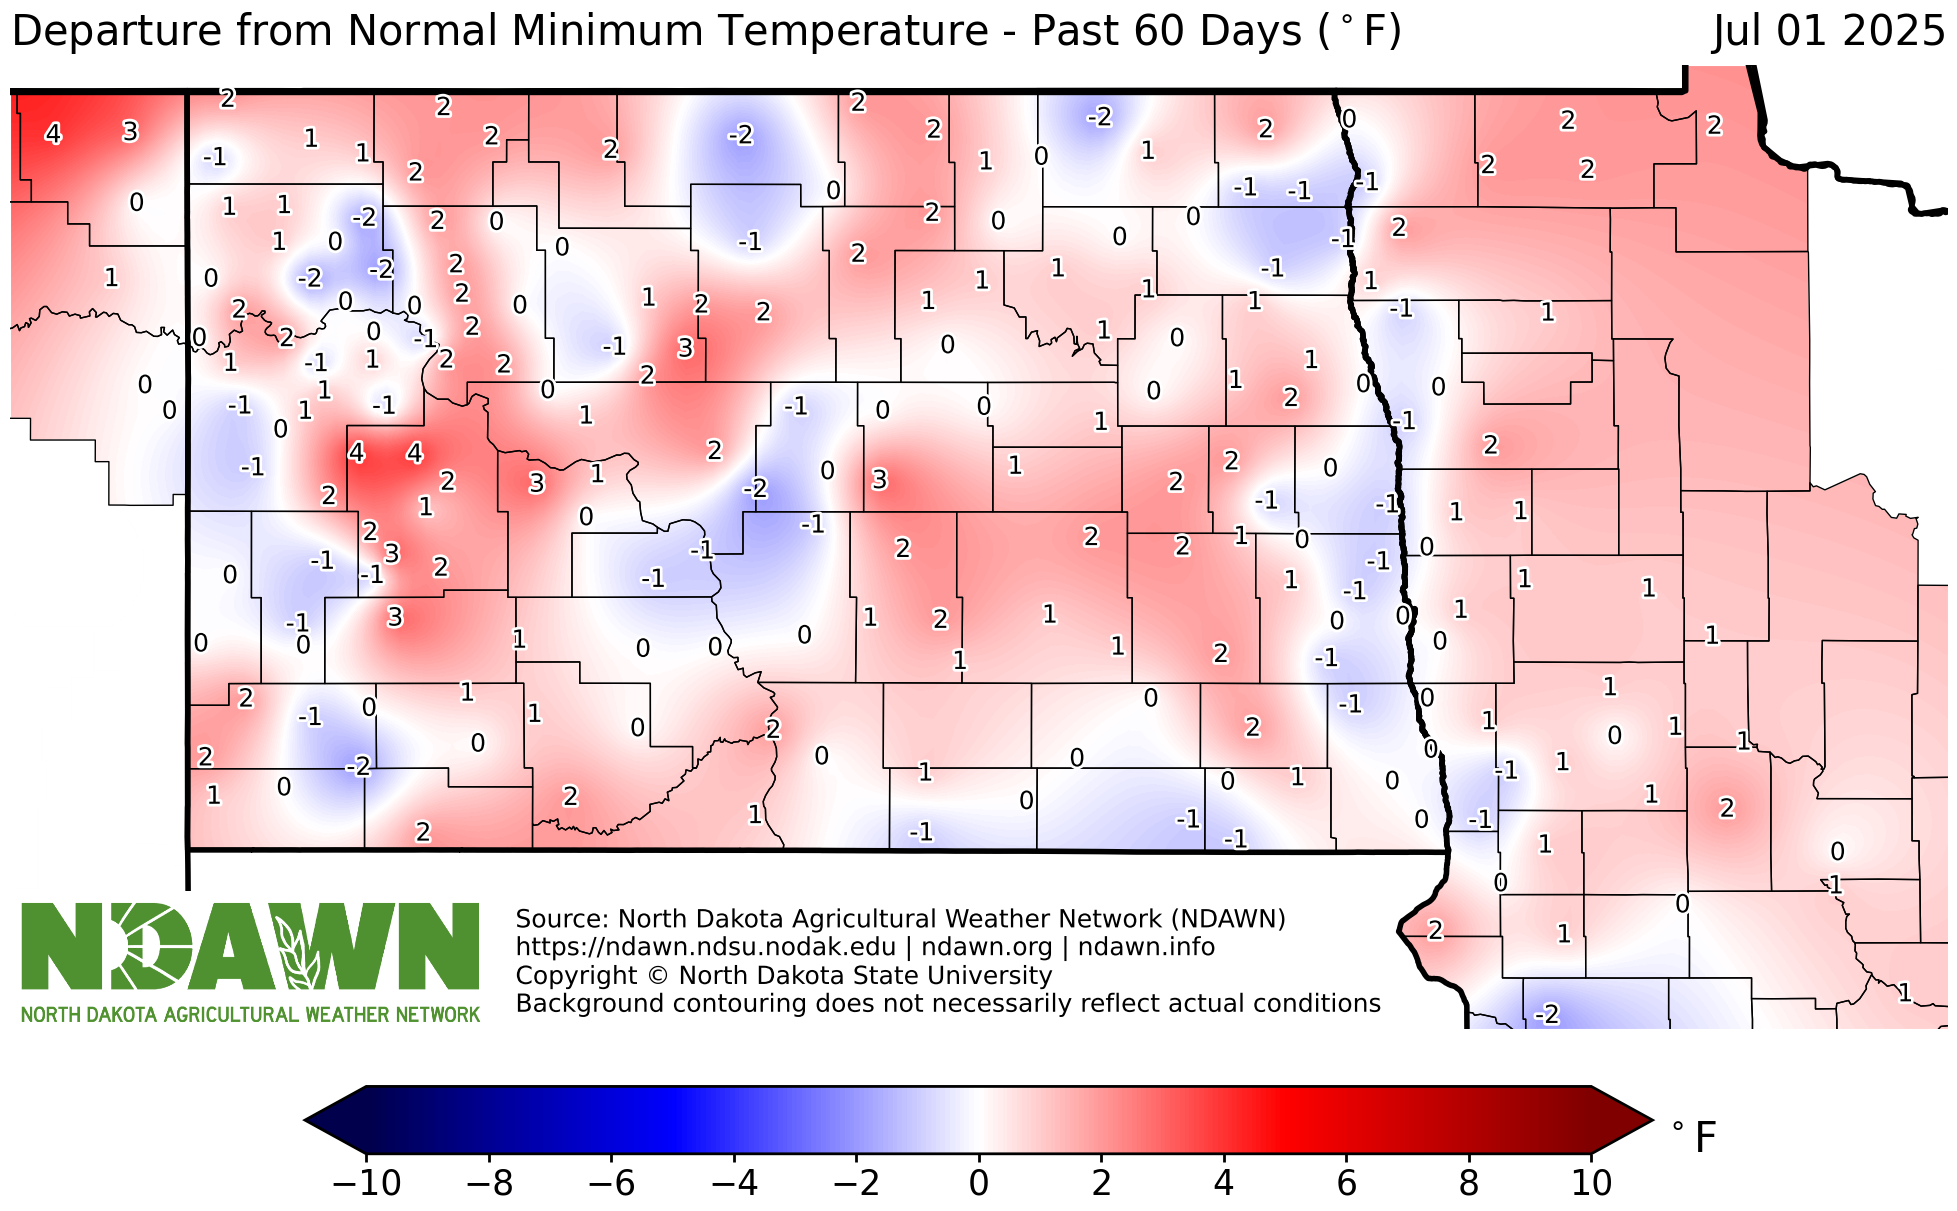
Departure from Normal Min Temperature - Past 60 Days
View Larger Image
Departure from Normal Min Temperature - Current Month
View Larger Image
Departure from Normal Min Temperature - Since January 1, 2026
View Larger Image
Departure from Normal Min Temperature - Since May 1, 2026
View Larger Image
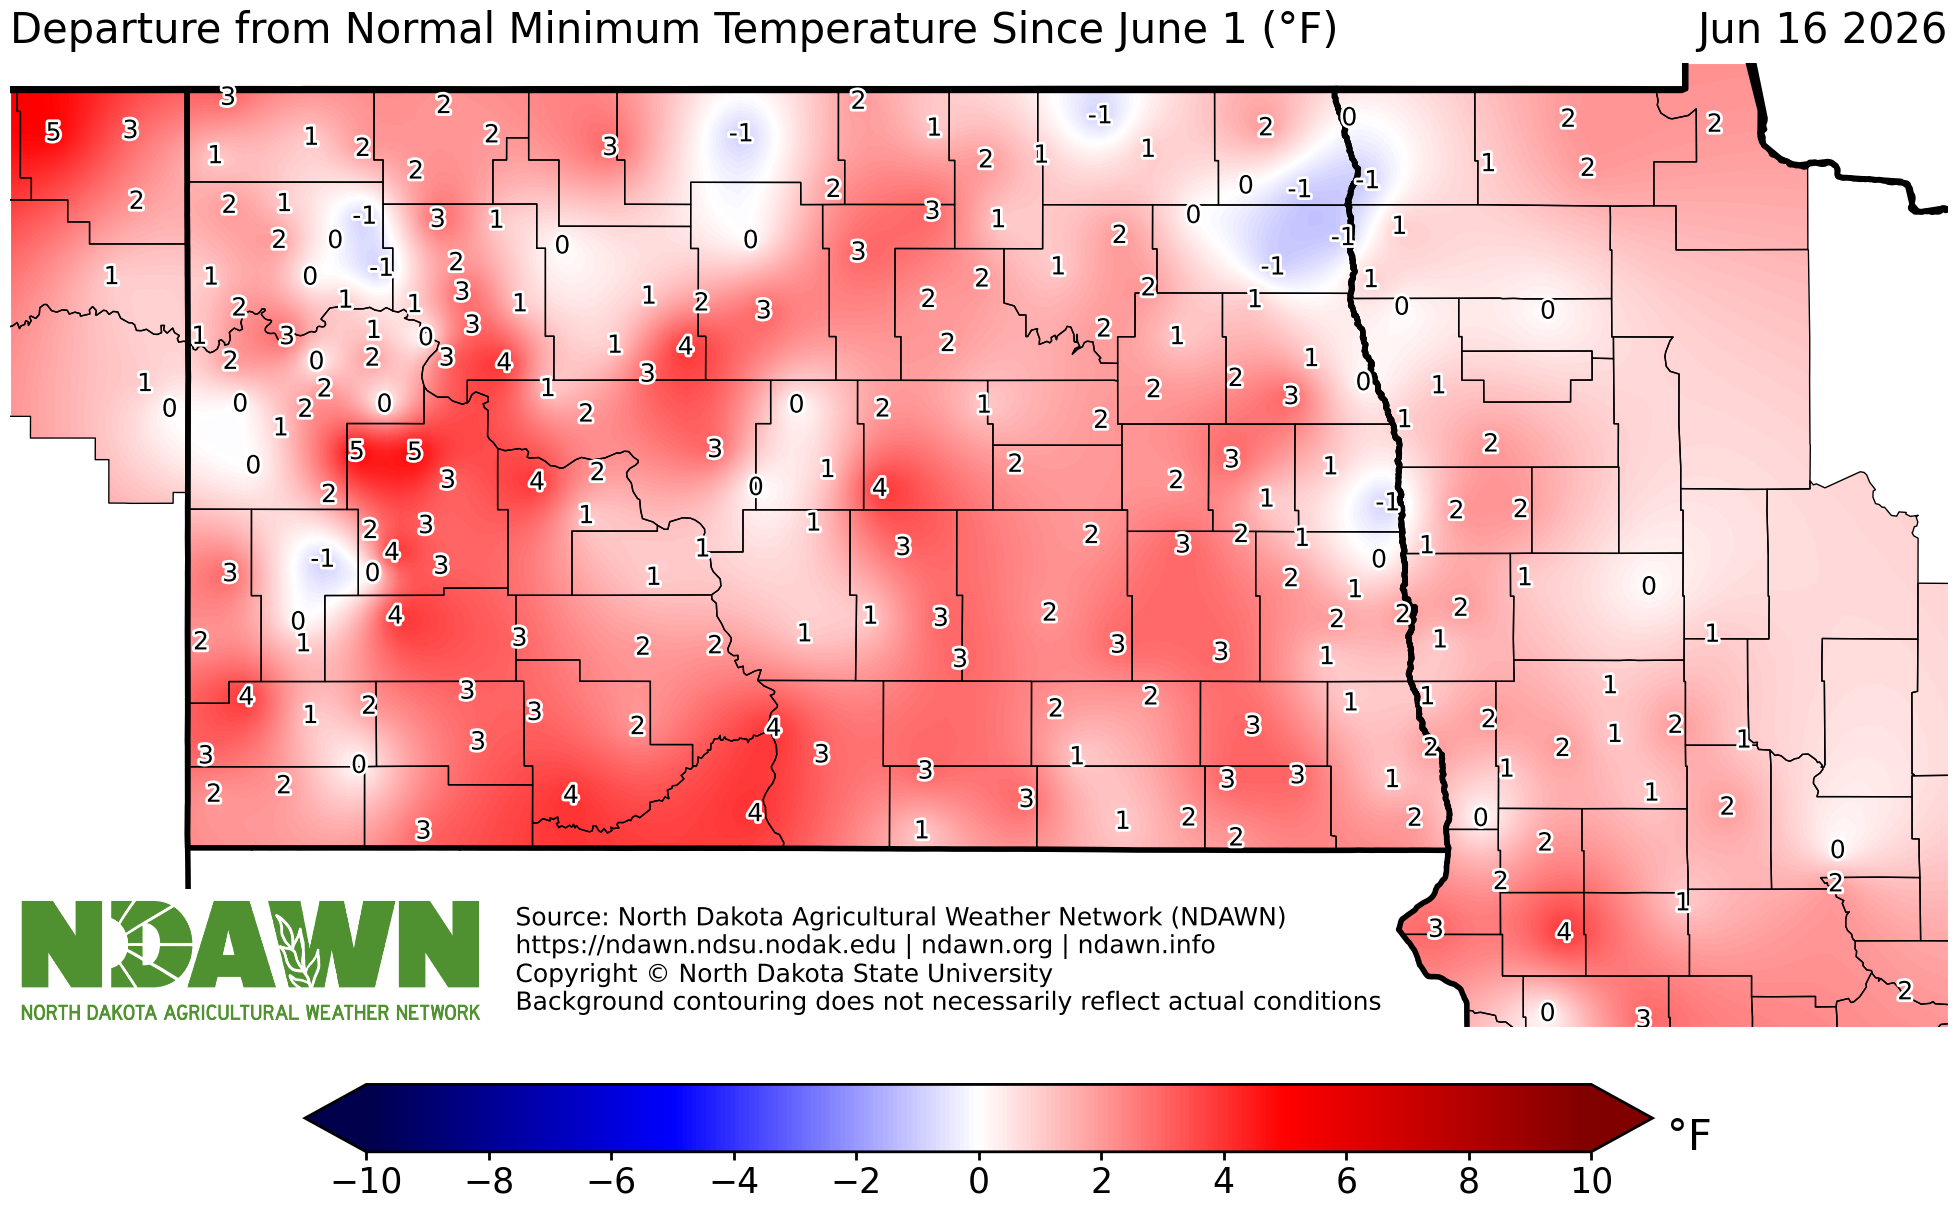
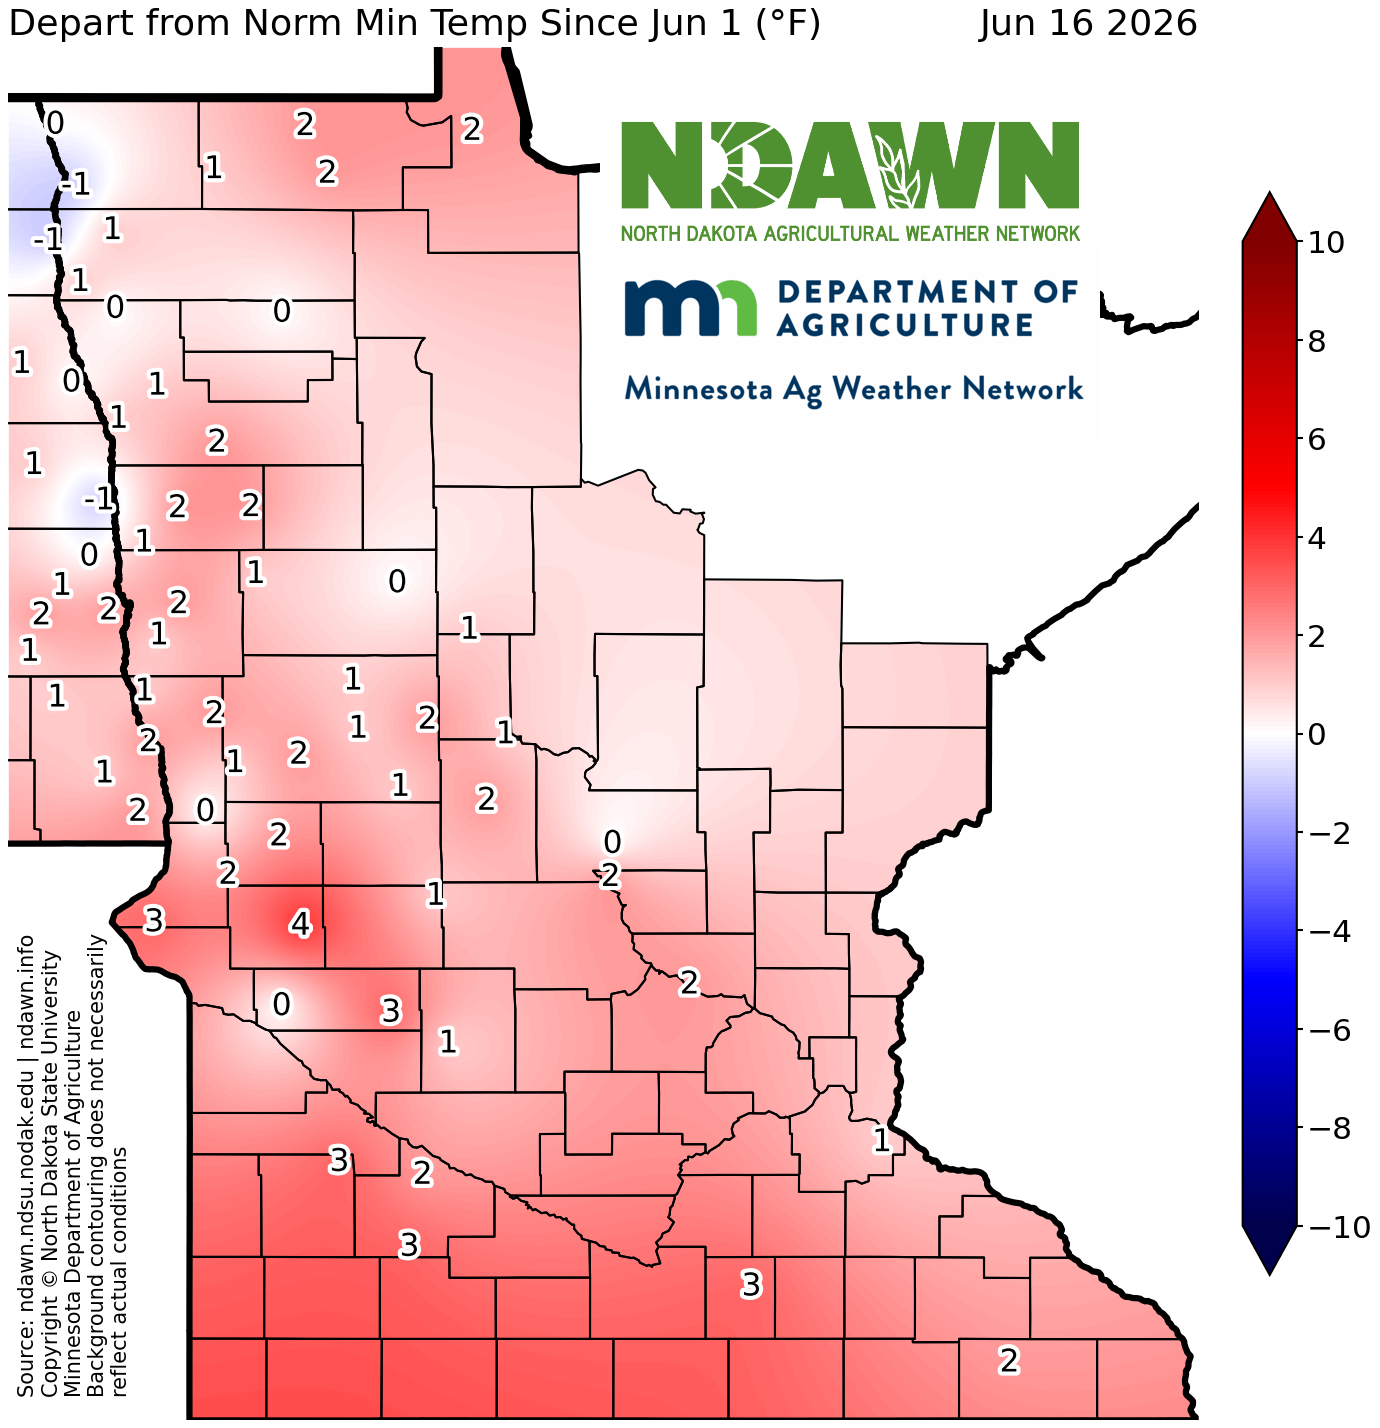
Departure from Normal Min Temperature - Since June 1, 2026
View Larger Image
Consecutive Days
Consecutive Days Minimum Temperature Below 0°F
View Larger Image
Total Days Minimum Temperature Below 0°F
View Larger Image
Consecutive Days Minimum Temperature Below 32°F
View Larger Image
Consecutive Days Maximum Temperature Below 32°F
View Larger Image
Consecutive Days Minimum Temperature Above 32°F
View Larger Image
Consecutive Days Maximum Temperature Above 90°F
View Larger Image
Total Days Maximum Temperature Above 90°F
View Larger Image
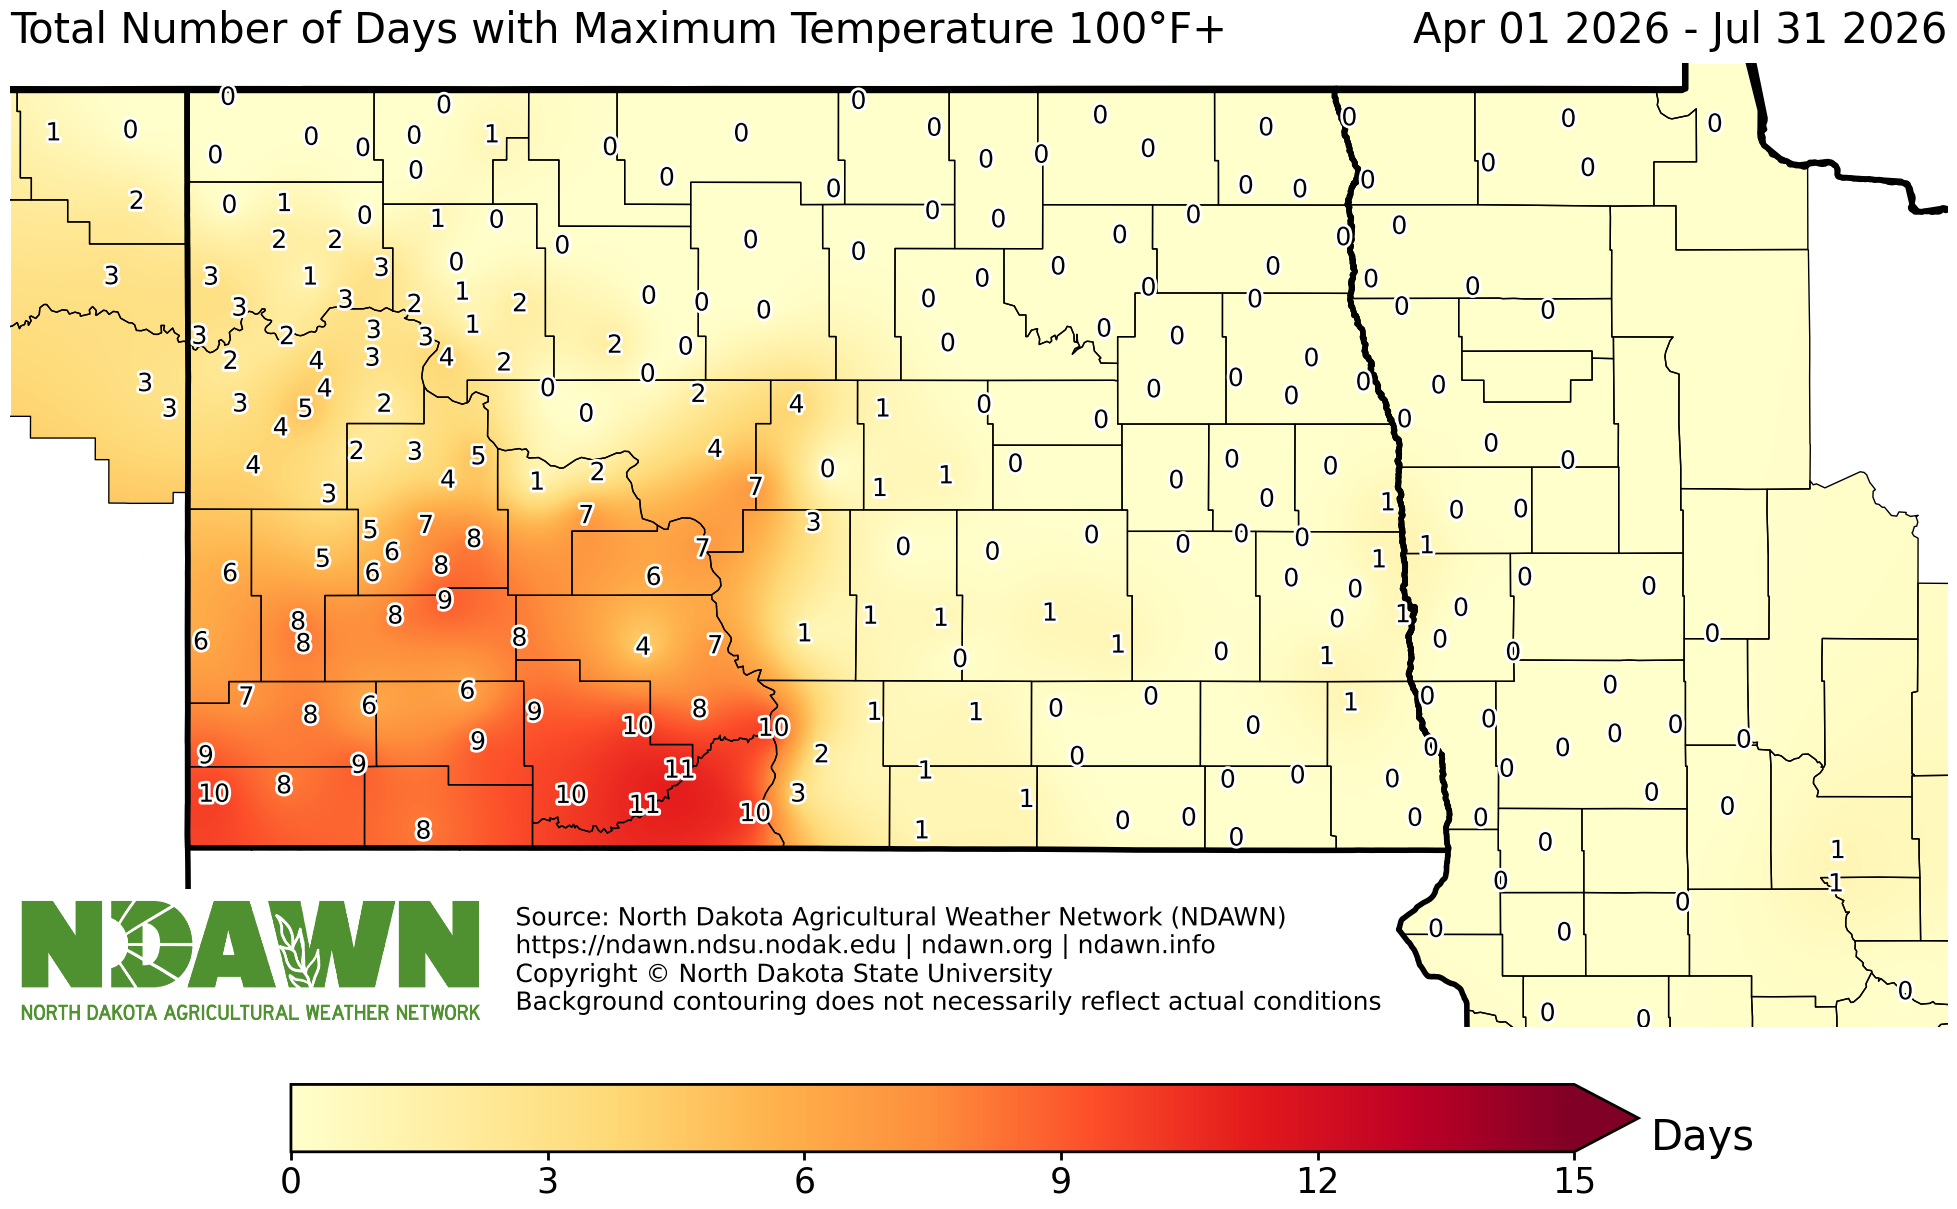
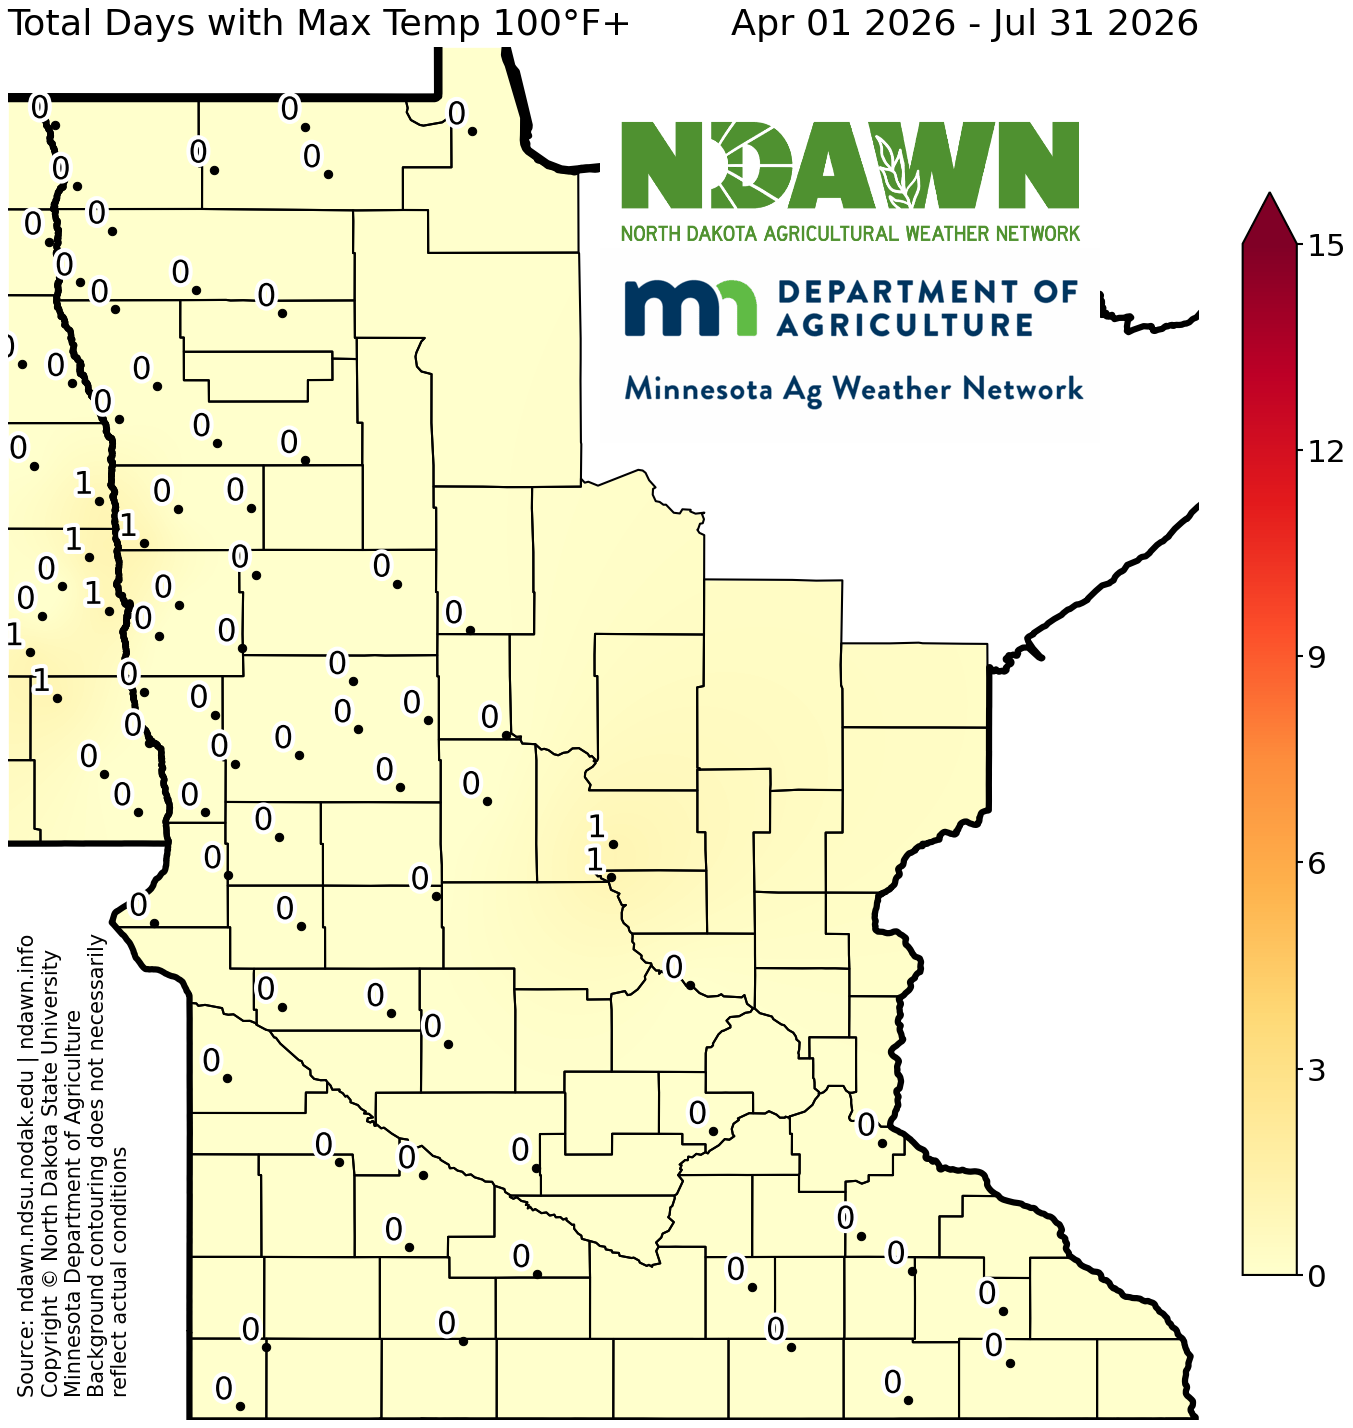
Total Days Maximum Temperature Above 100°F
View Larger Image
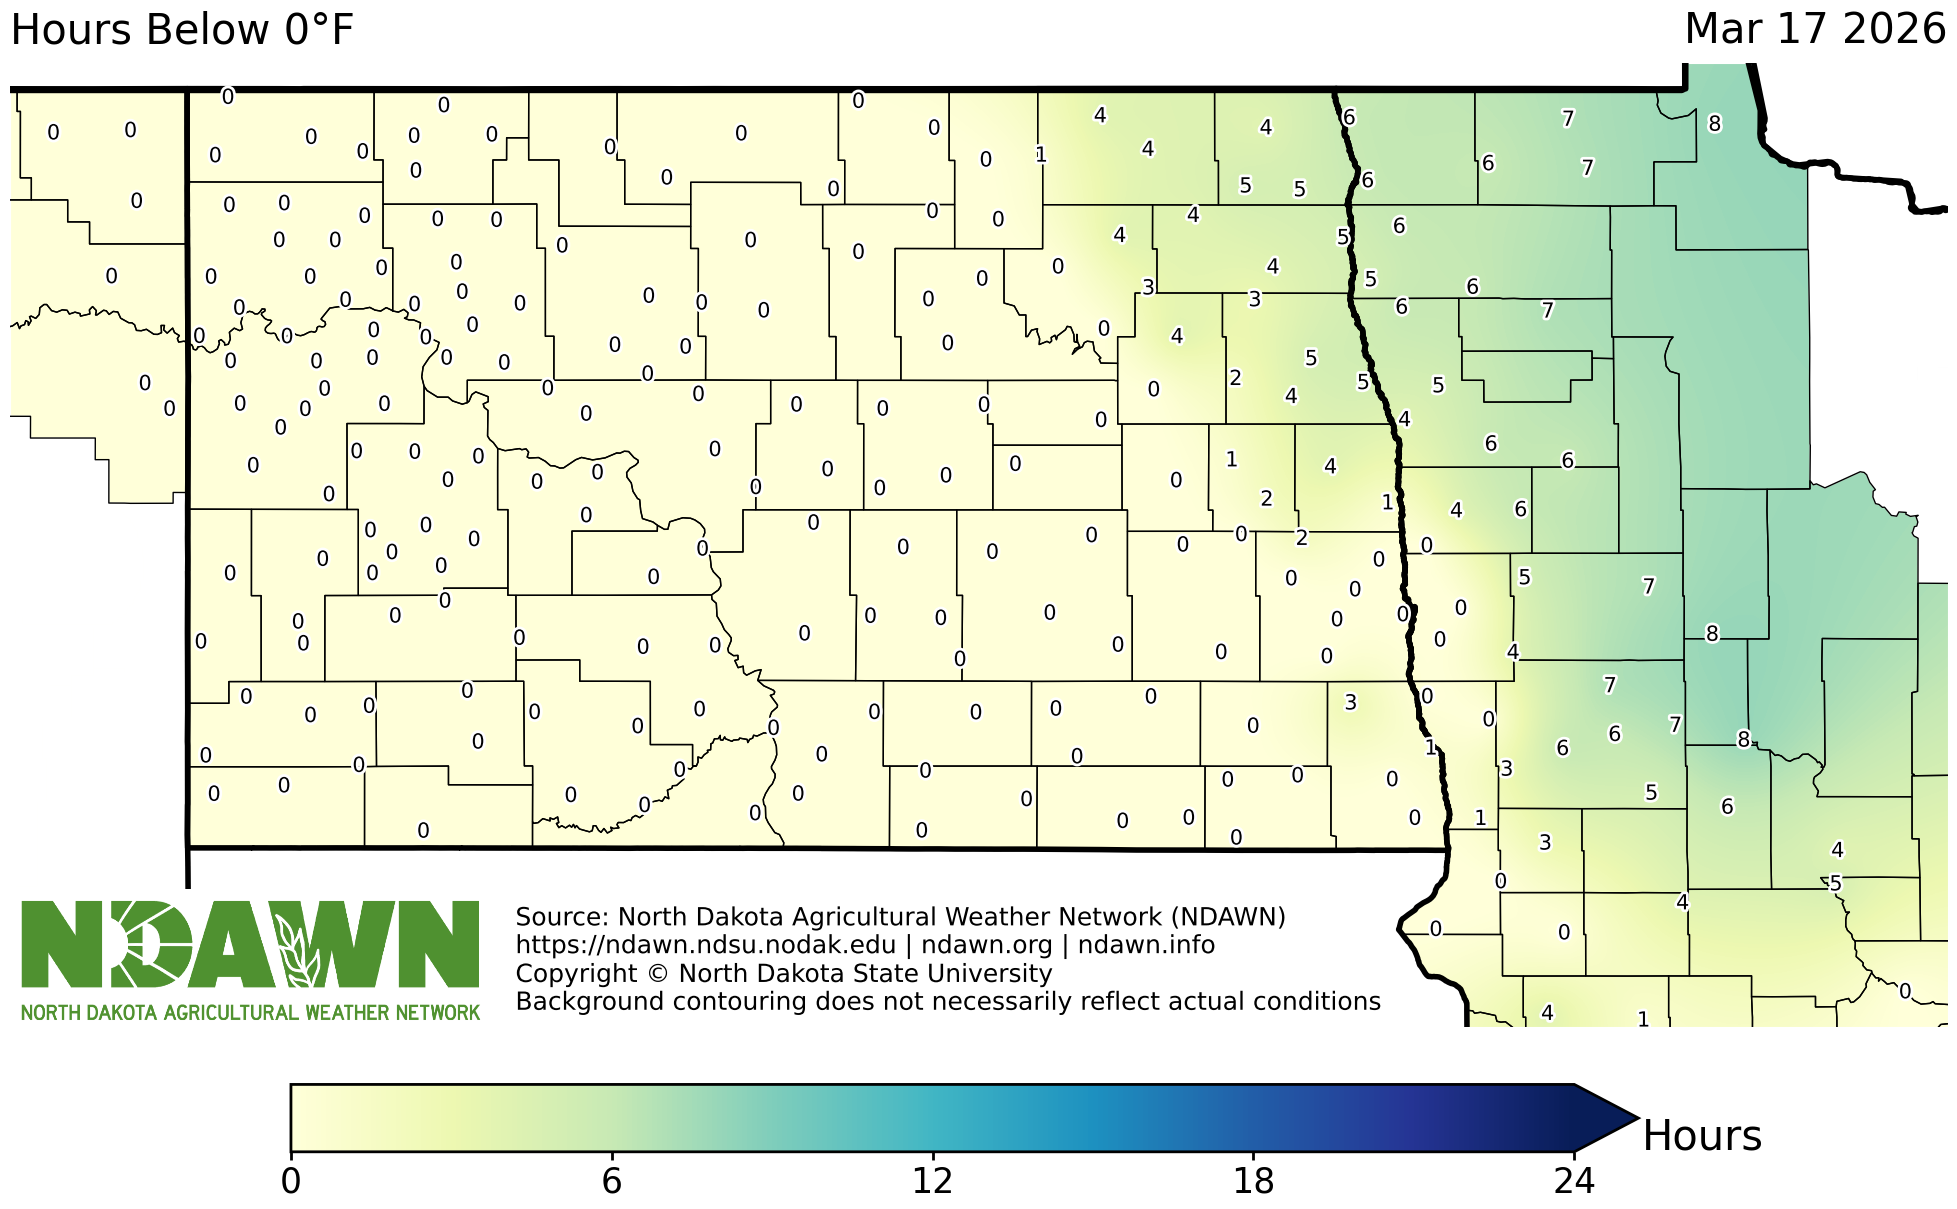
Total Hours Below Temperature
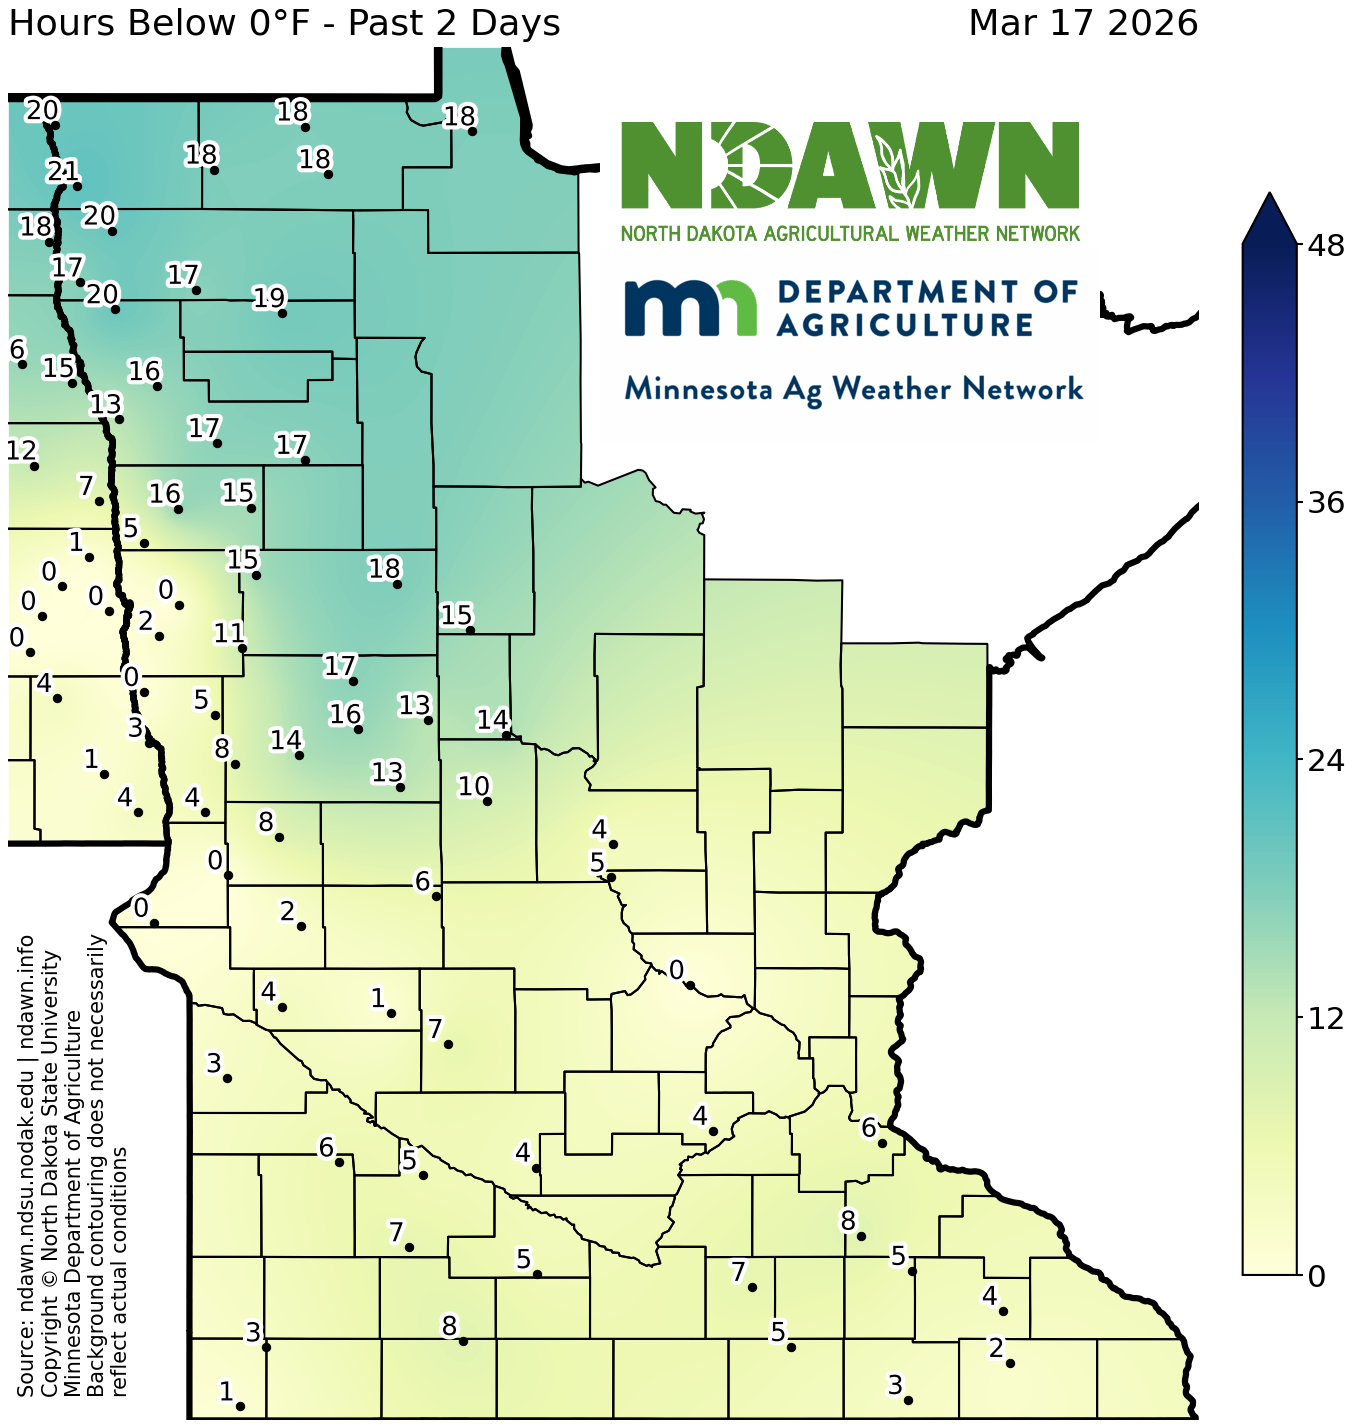
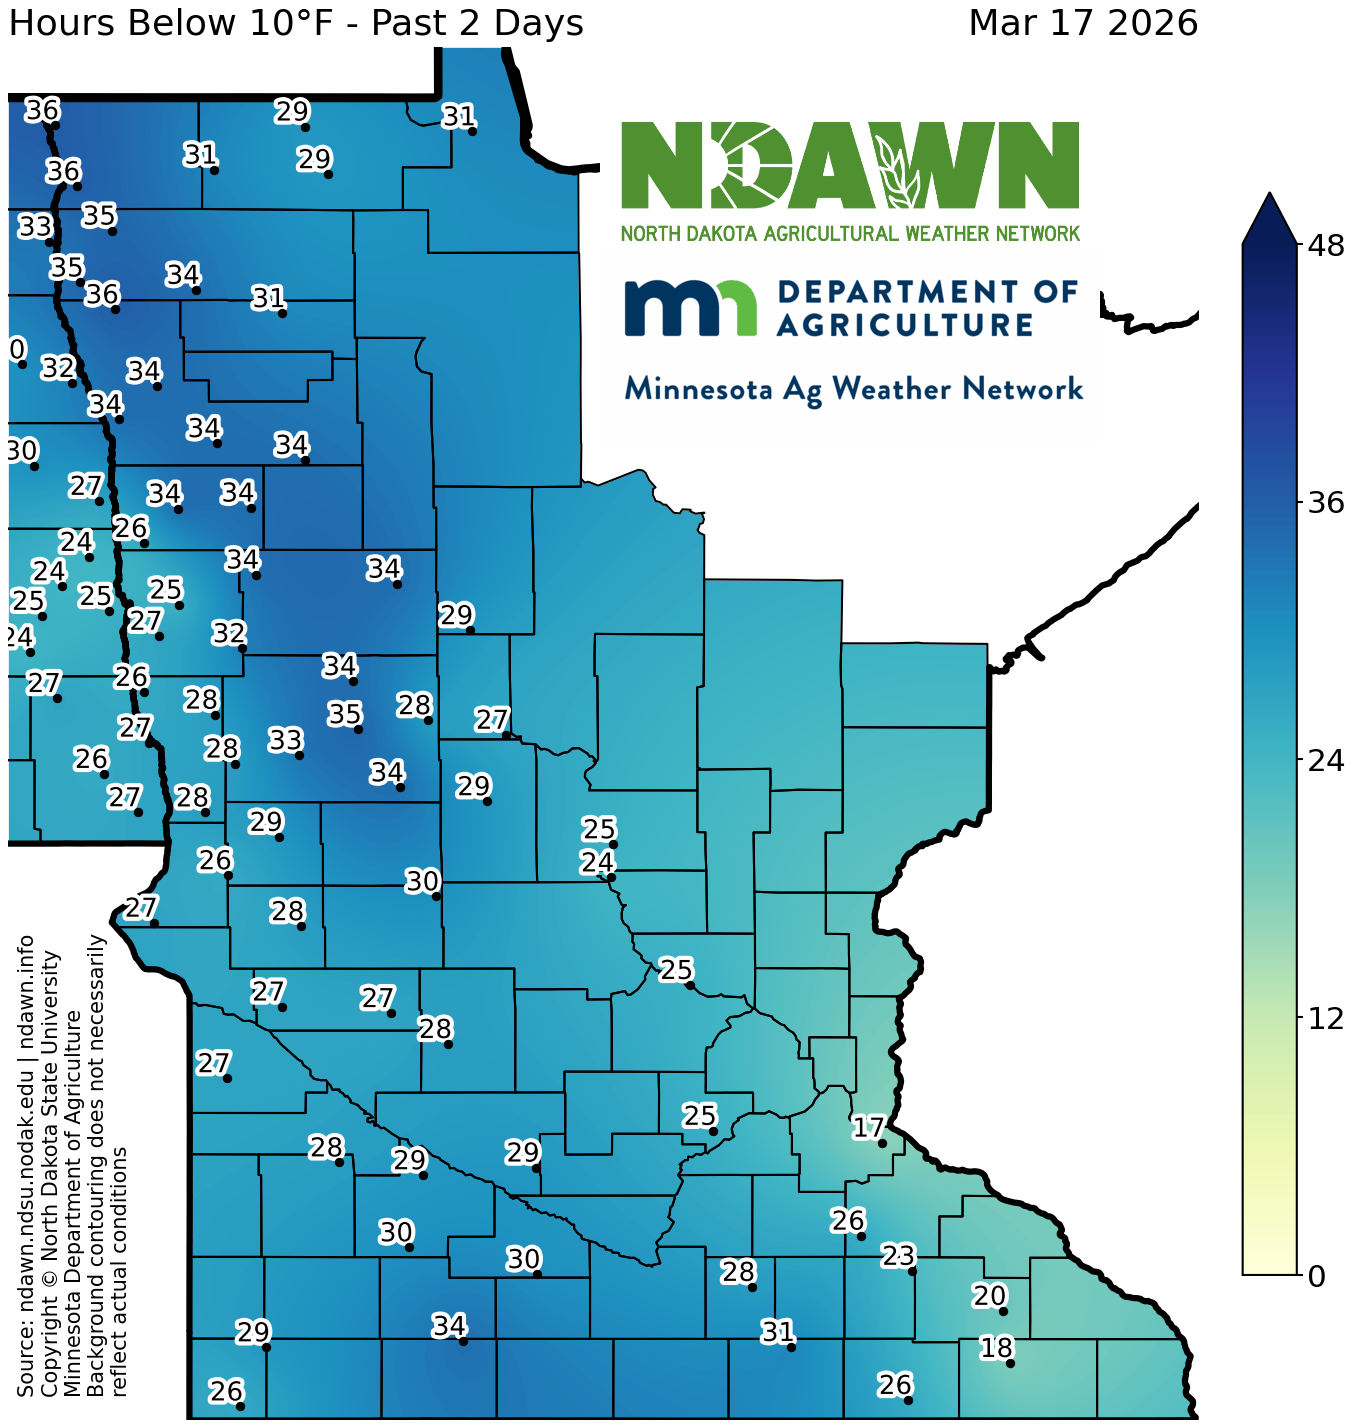
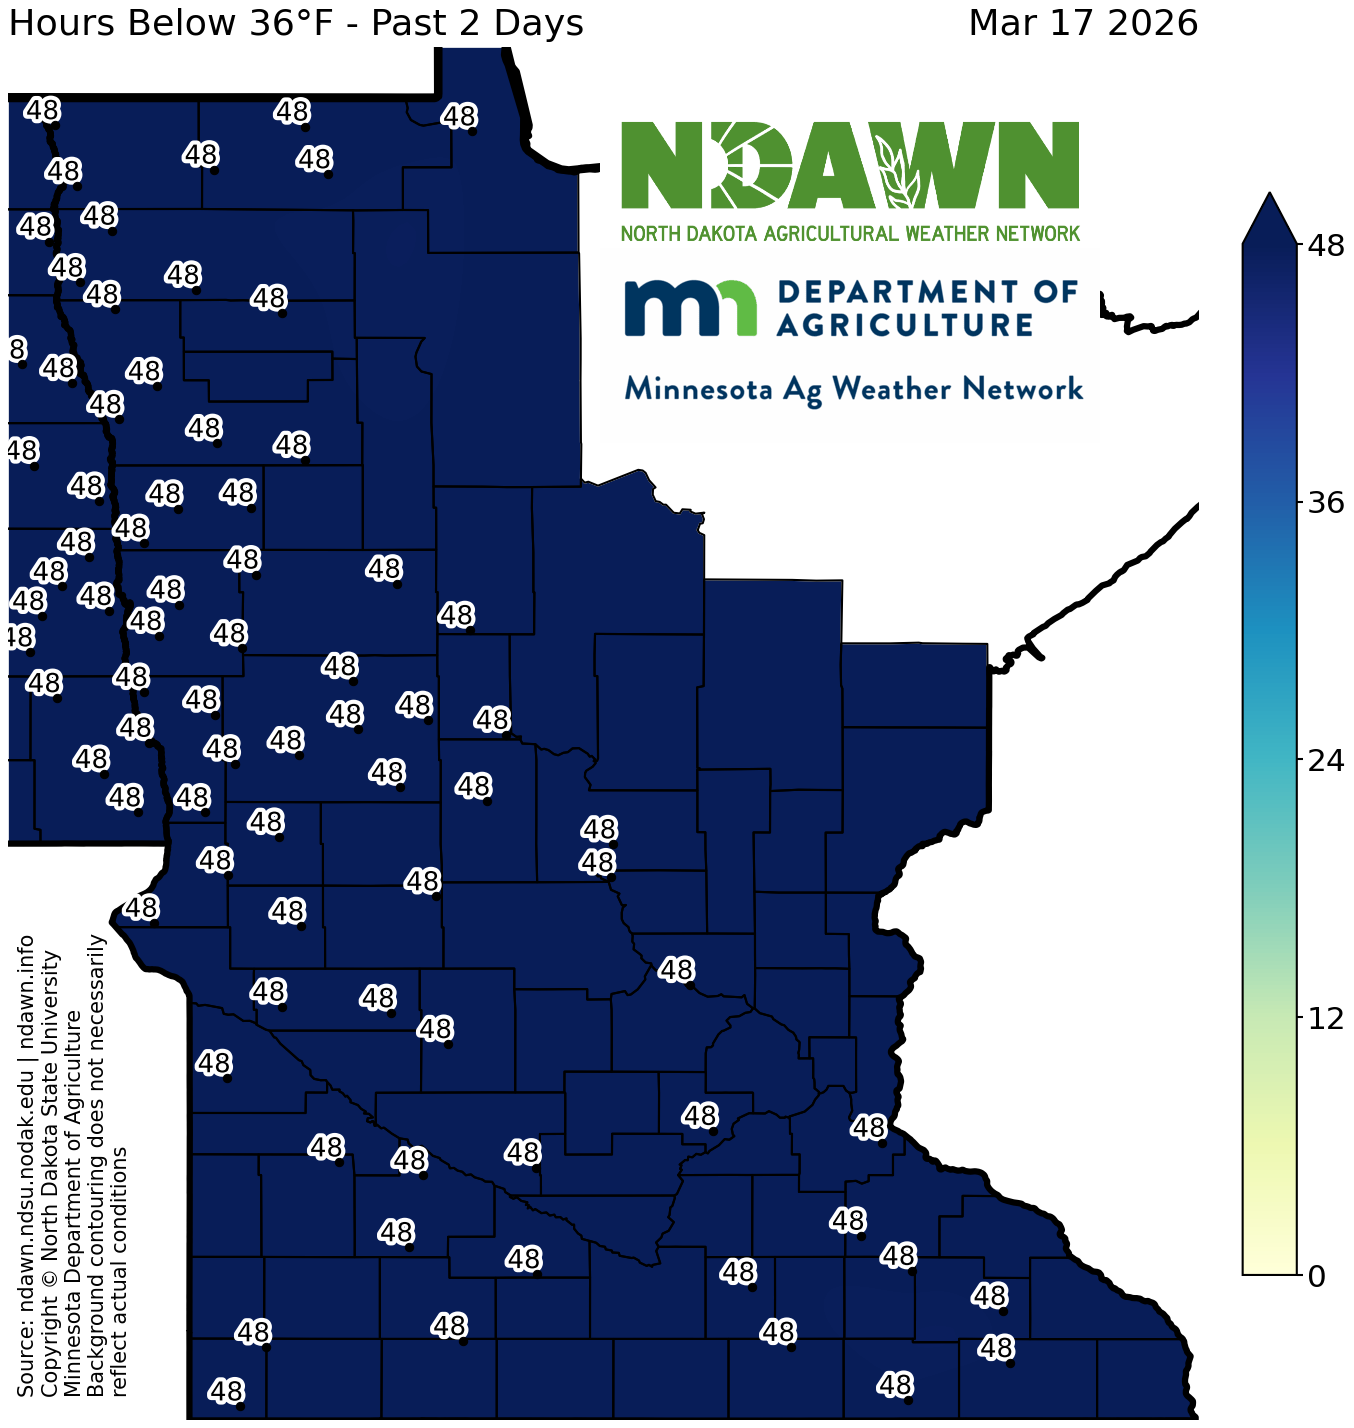
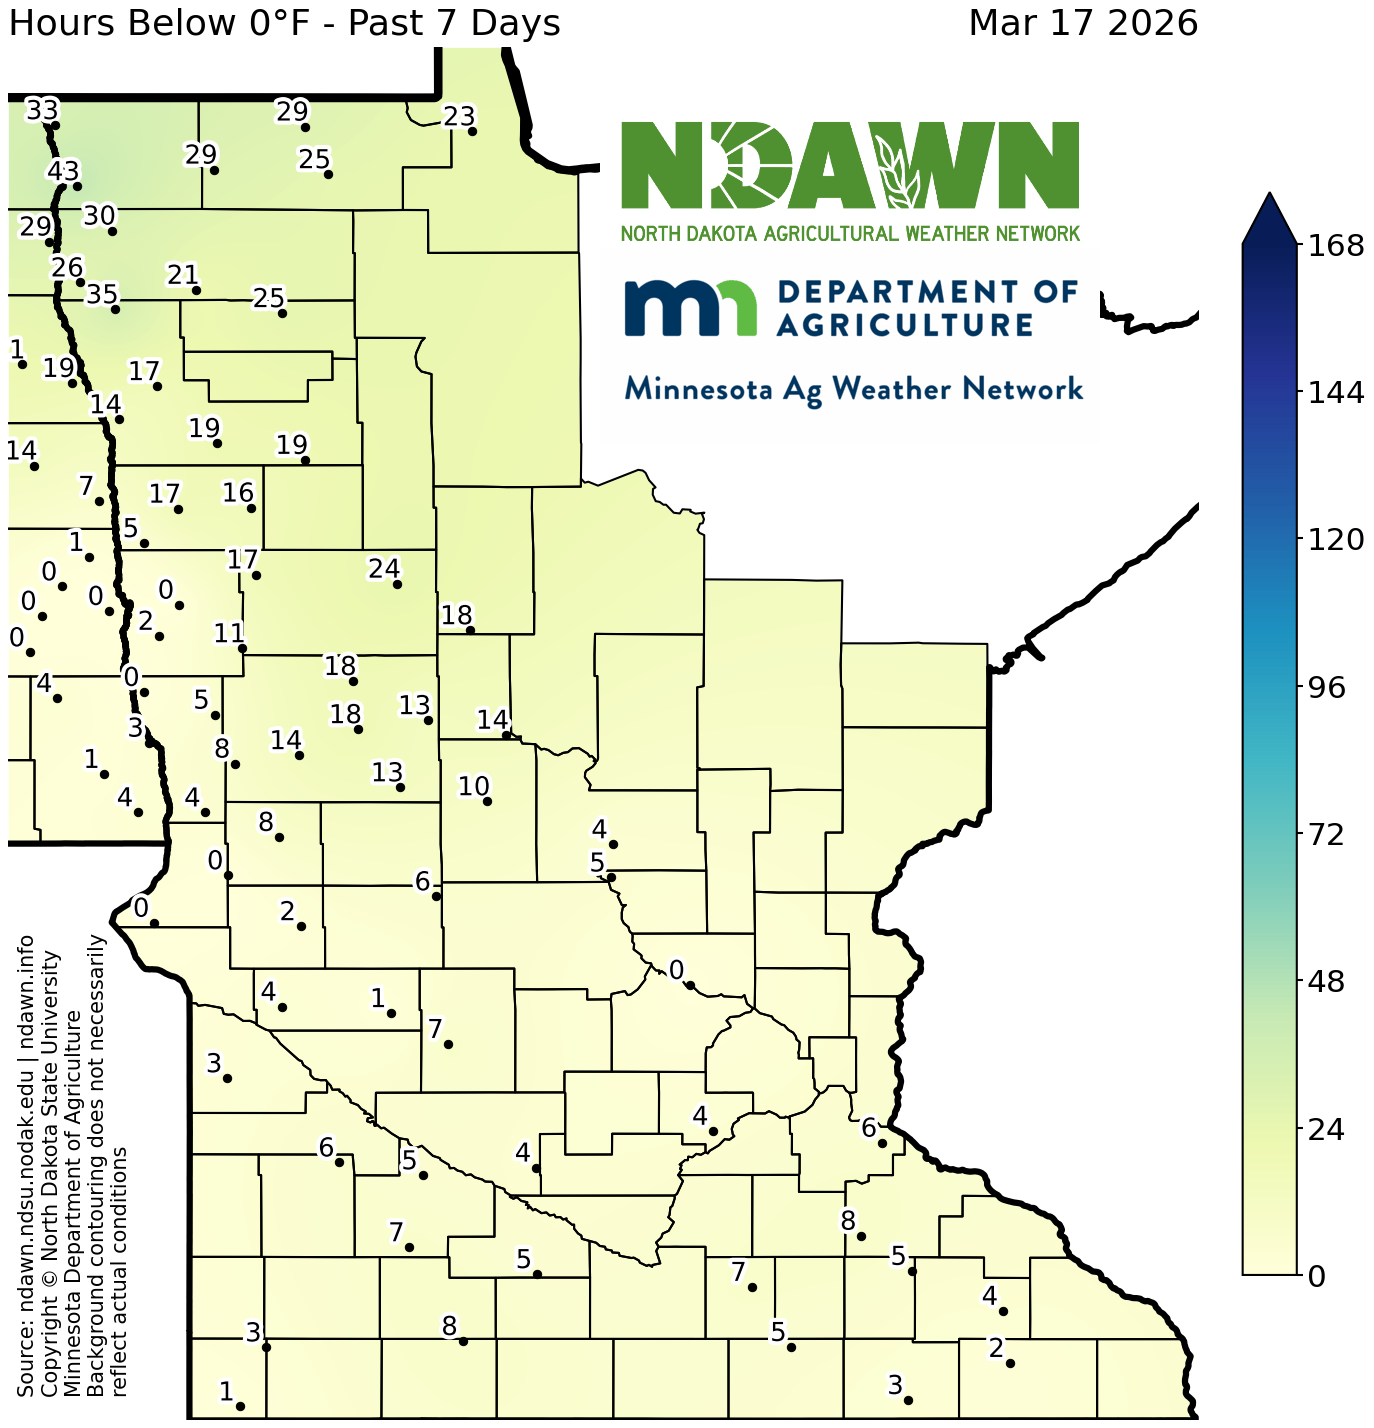
Totals are calculated from midnight to midnight Central Standard Time and do not include the current day.
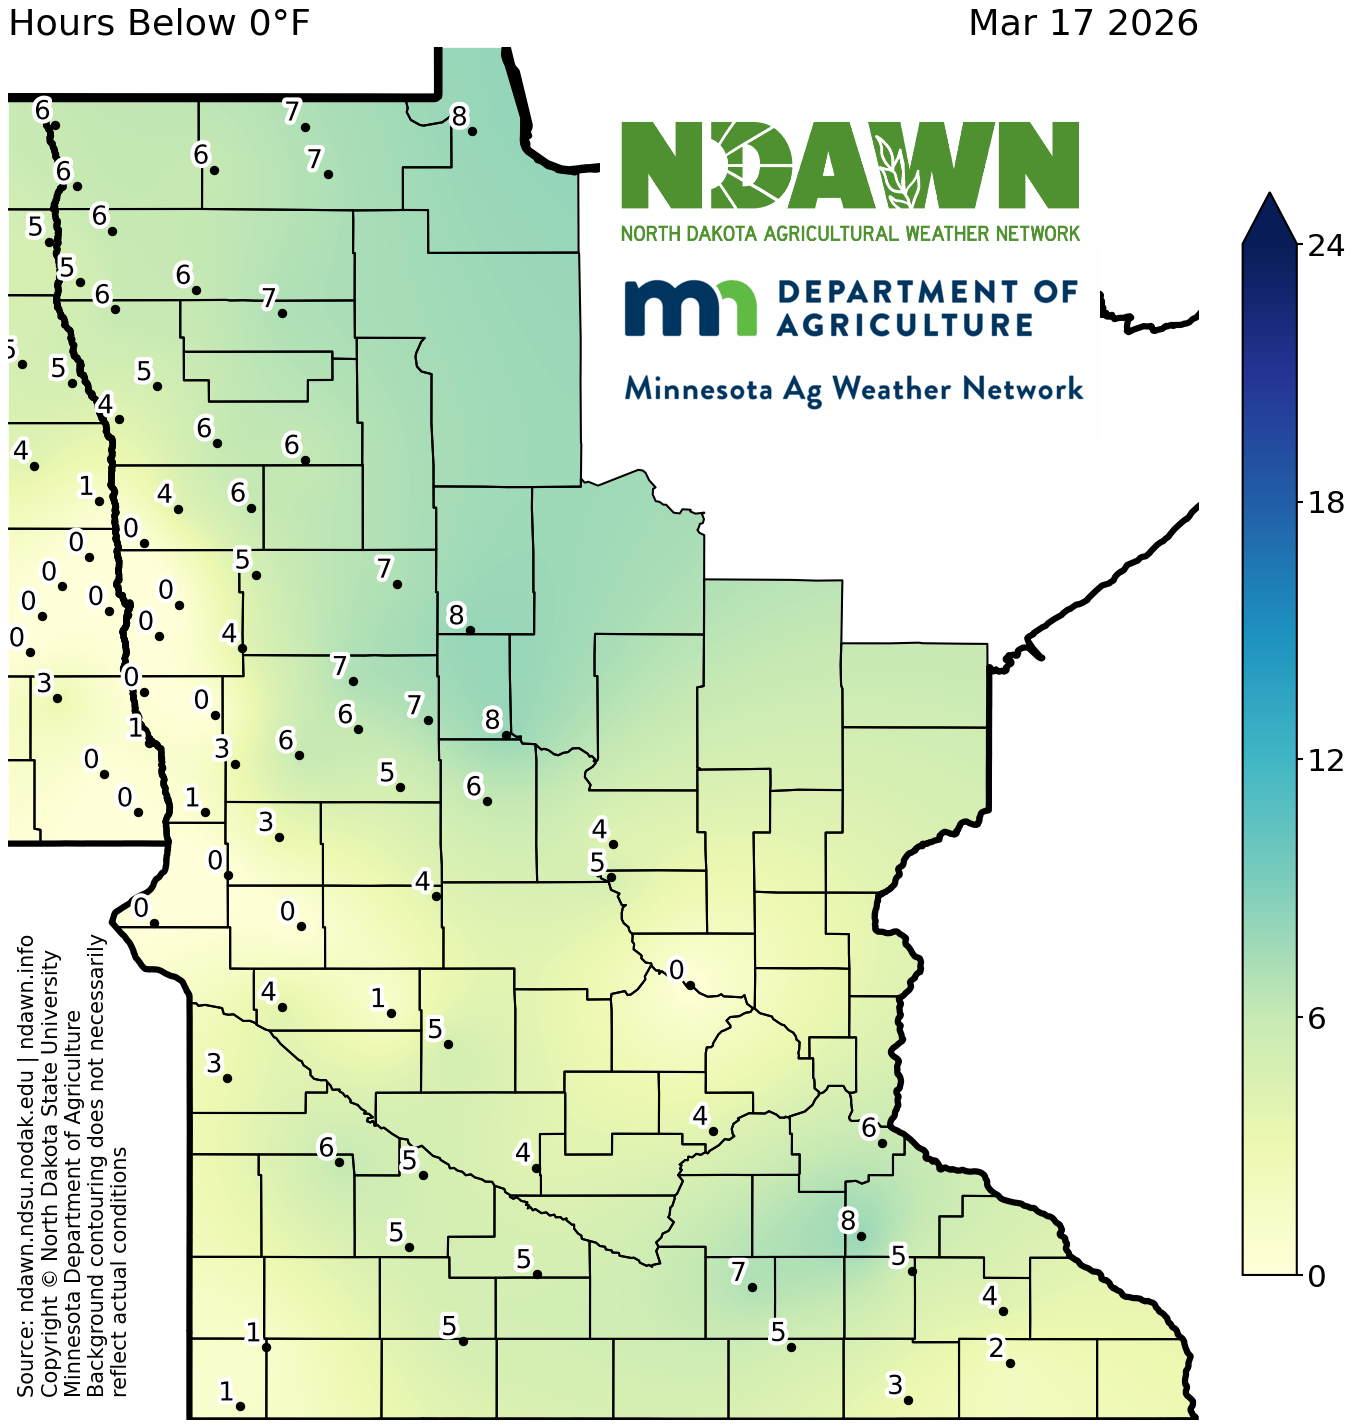
Total Hours Below 0°F - Yesterday
View Larger Image
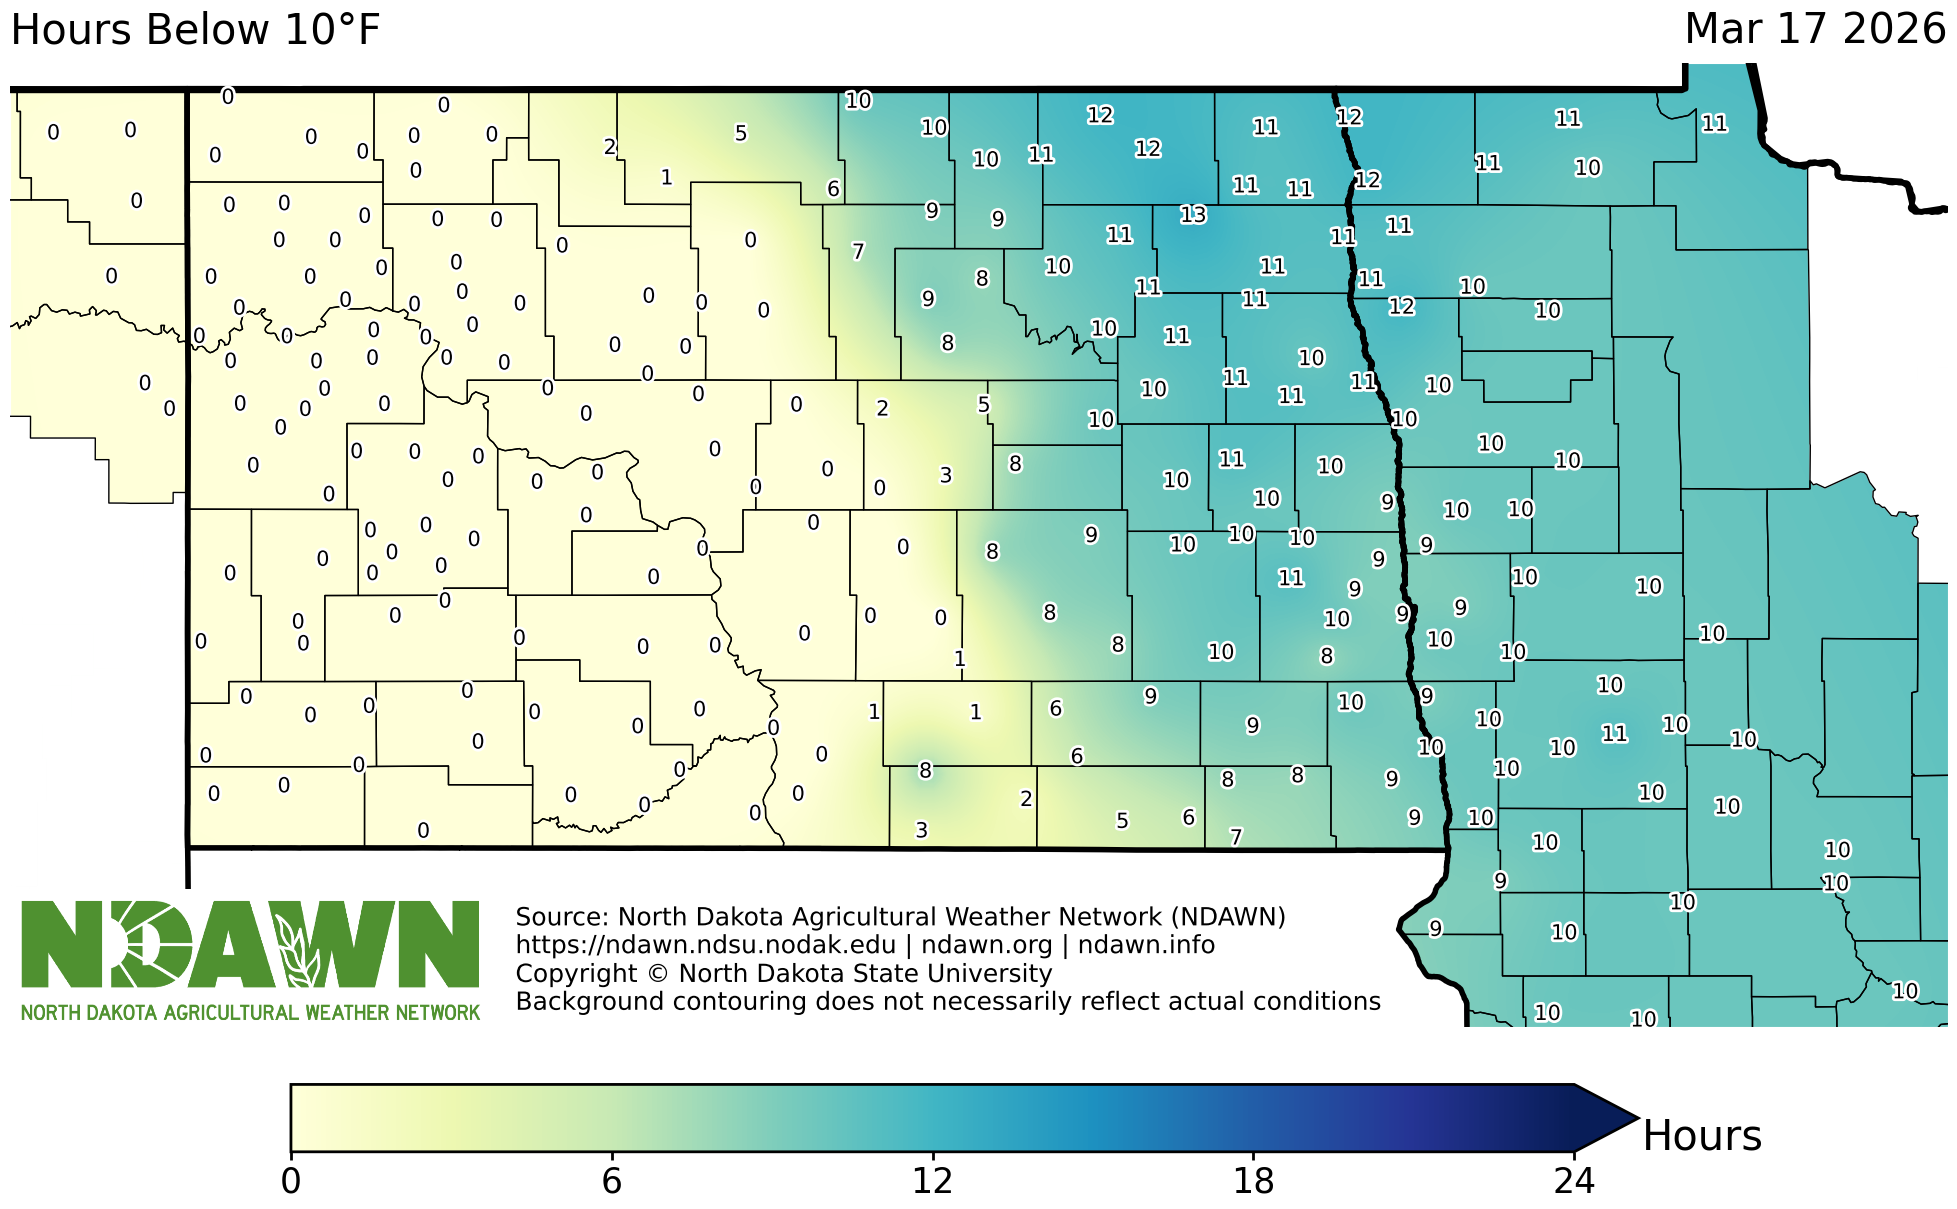
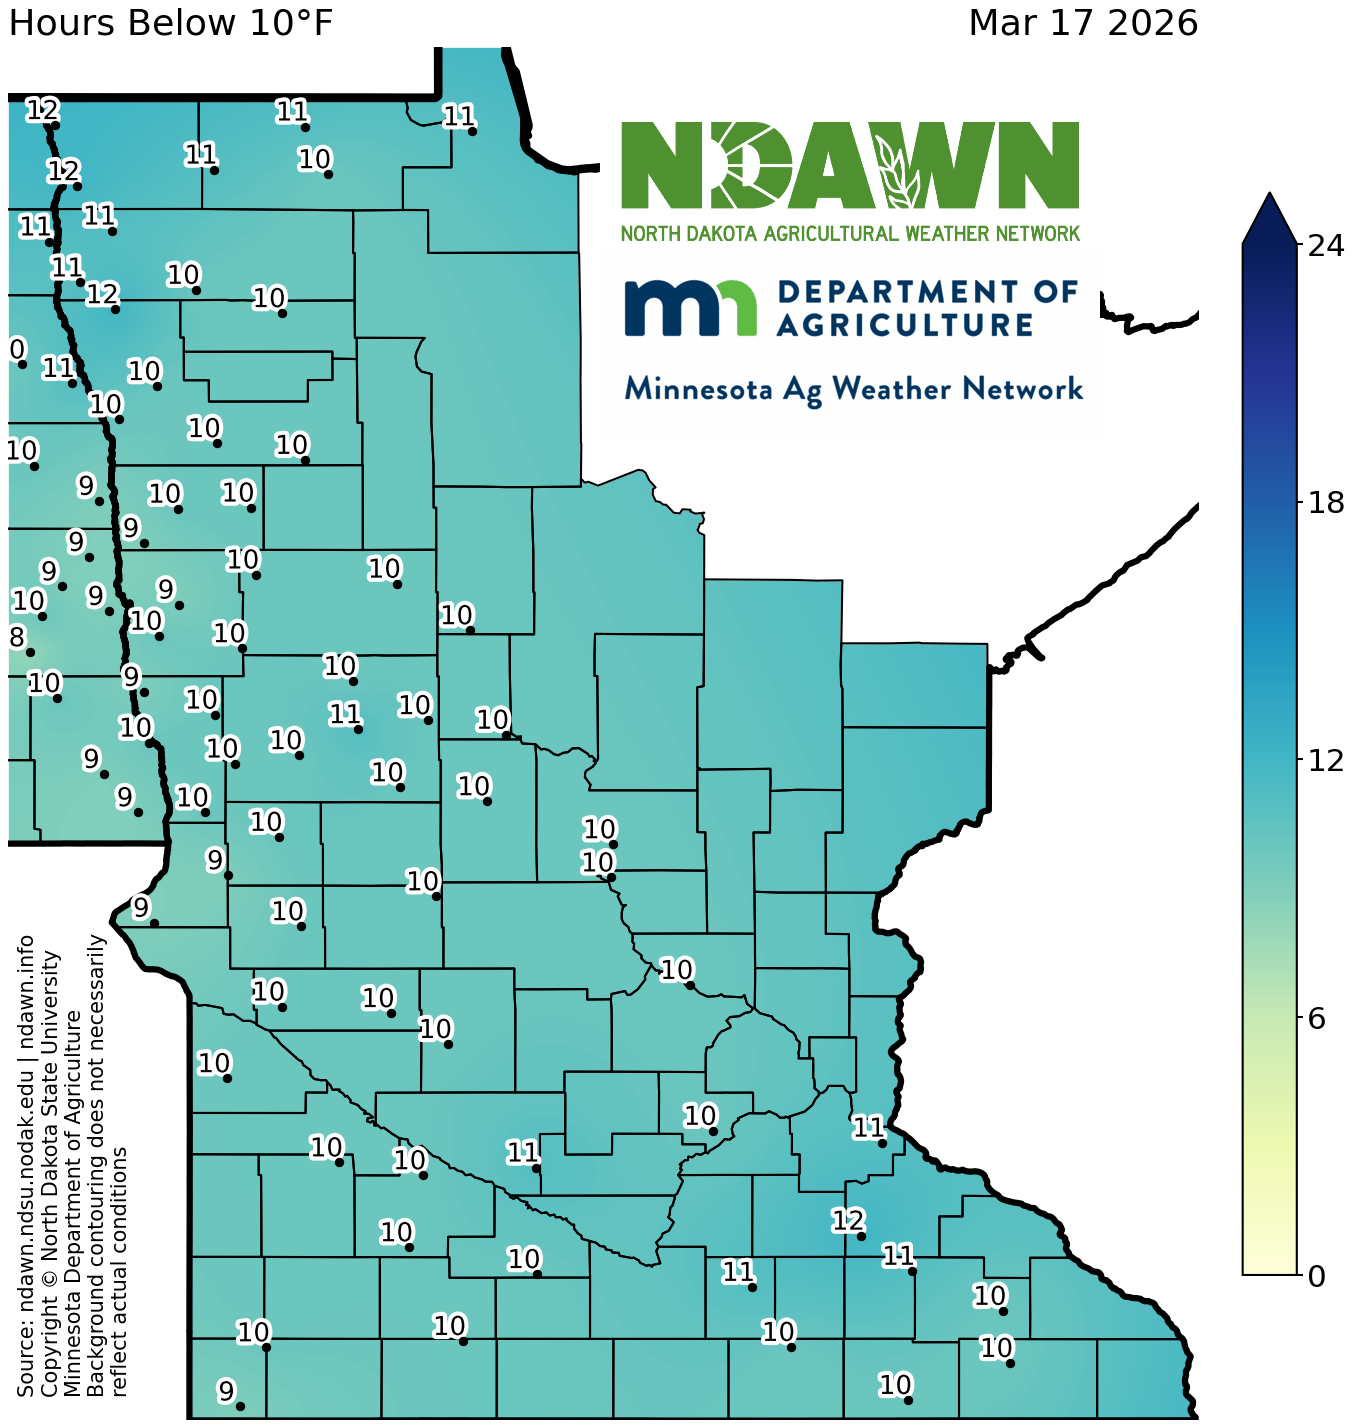
Total Hours Below 10°F - Yesterday
View Larger Image
Total Hours Below 32°F - Yesterday
View Larger Image
Total Hours Below 36°F - Yesterday
View Larger Image
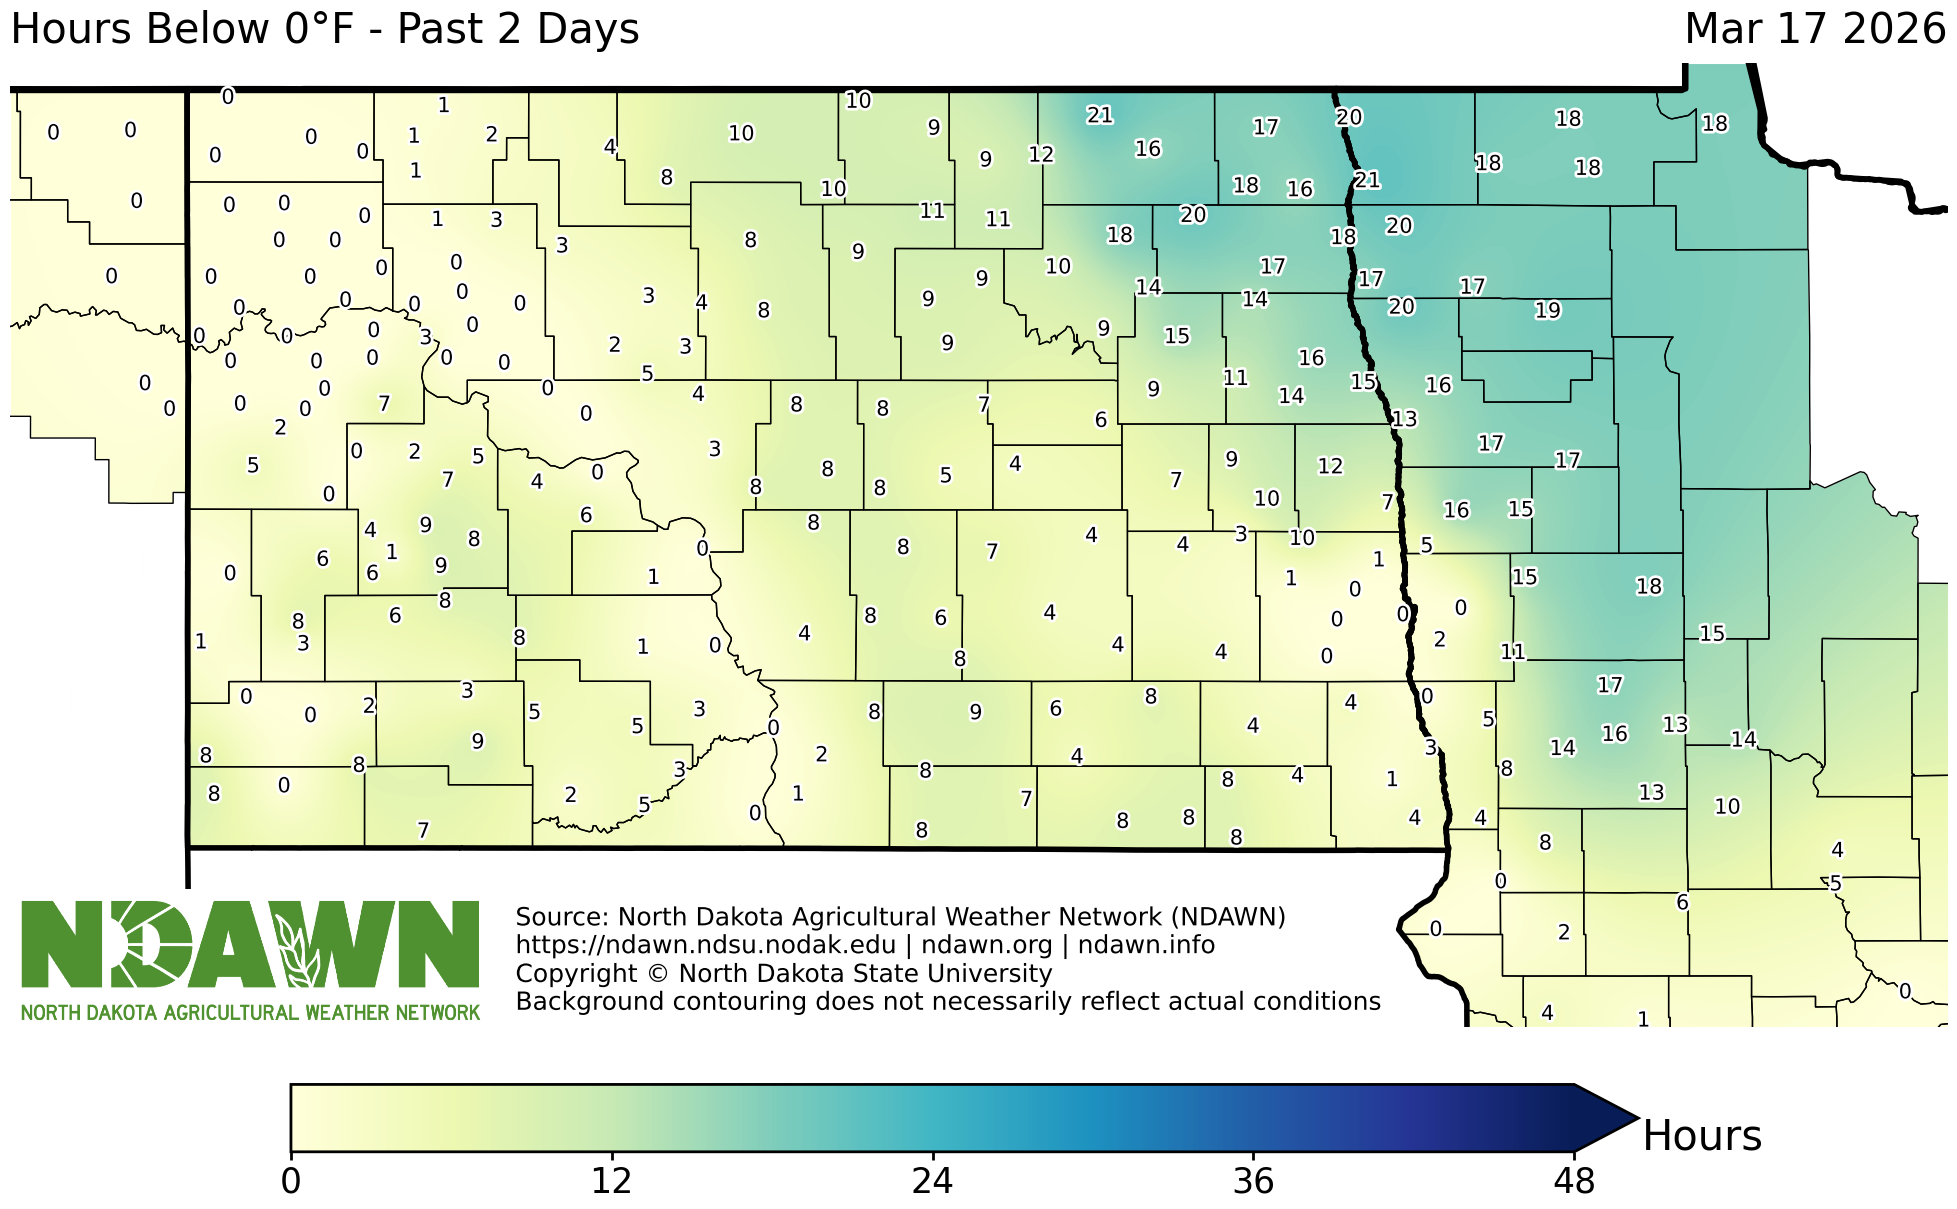
Total Hours Below 0°F - Past 2 Days
View Larger Image
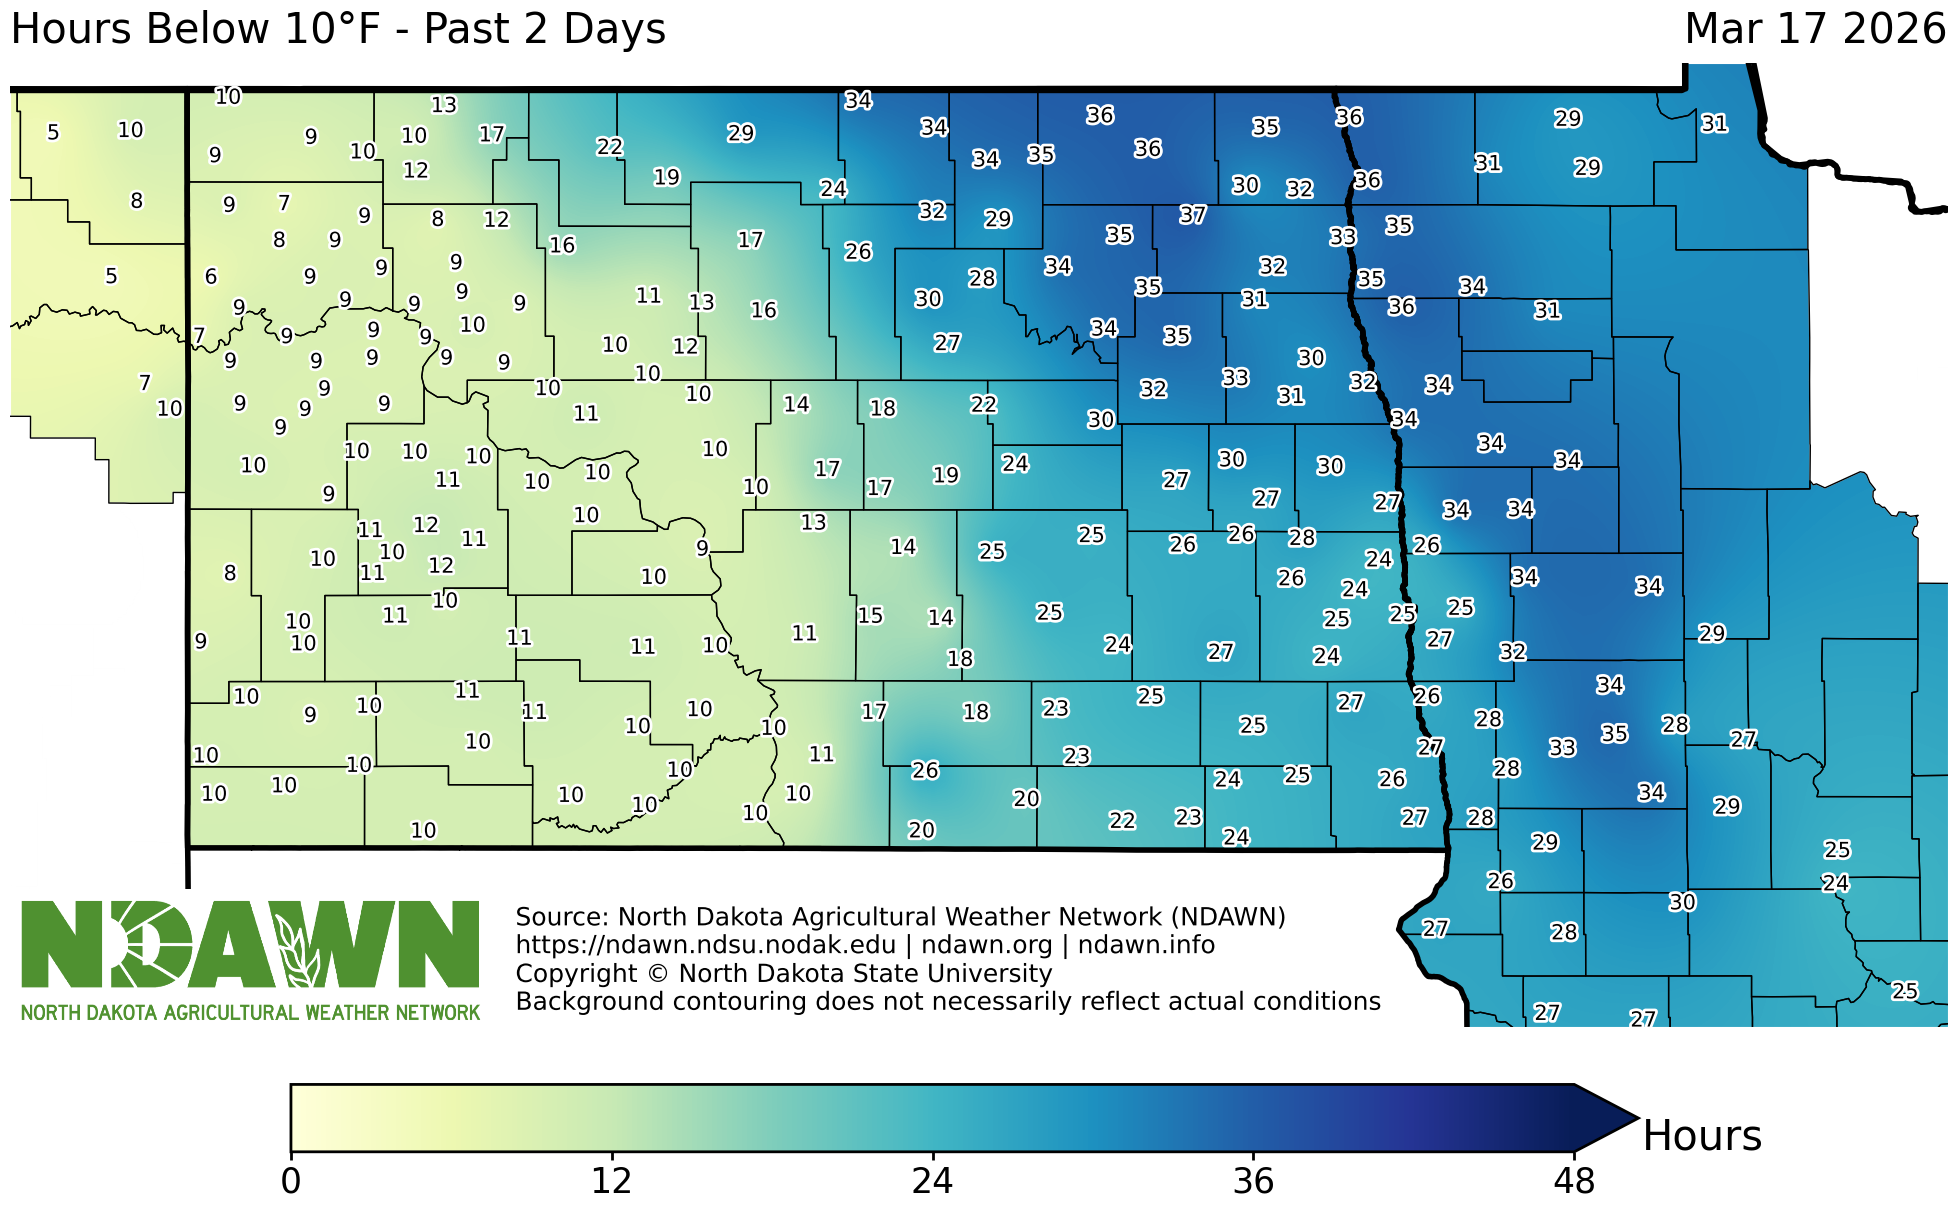
Total Hours Below 10°F - Past 2 Days
View Larger Image
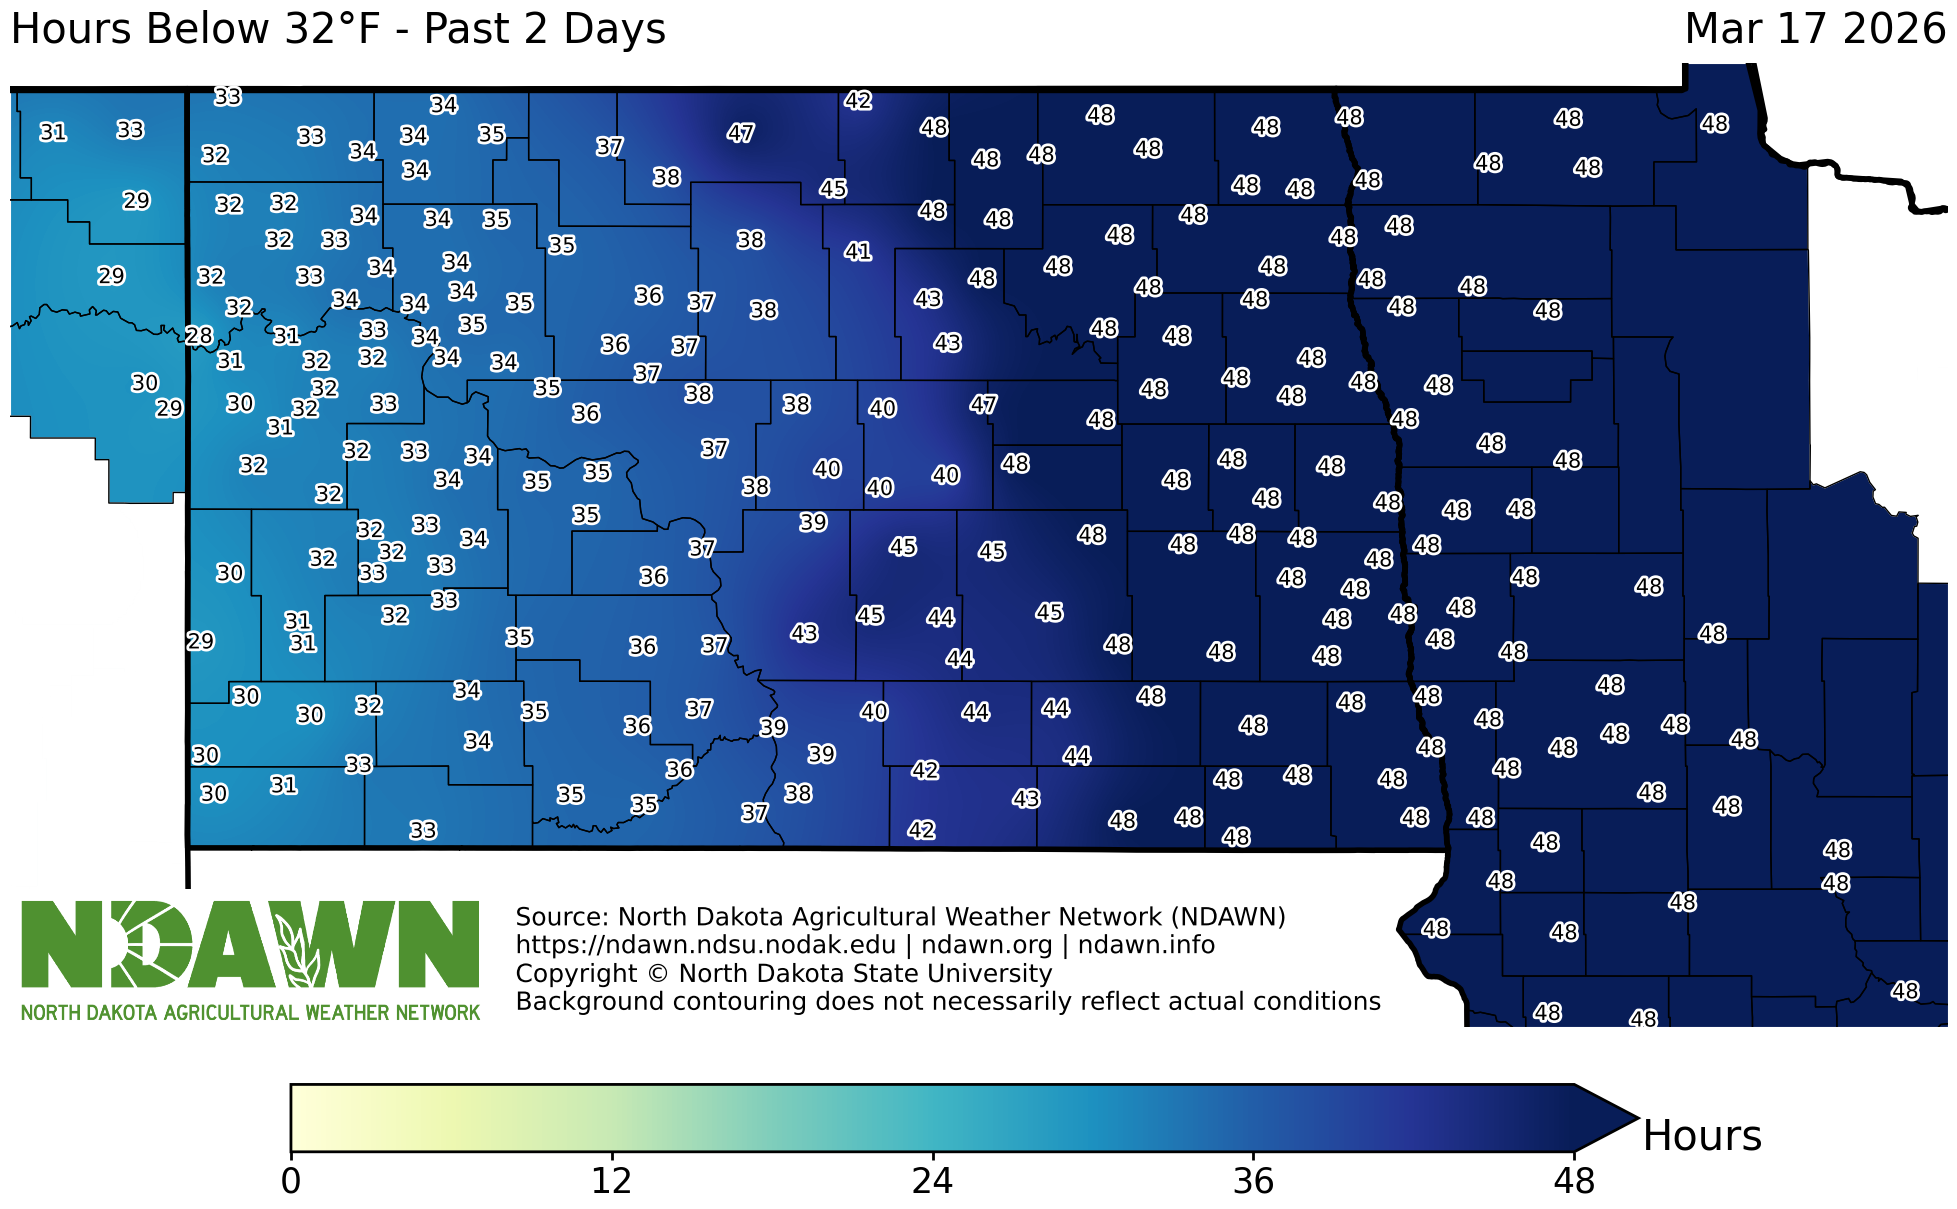
Total Hours Below 32°F - Past 2 Days
View Larger Image
Total Hours Below 36°F - Past 2 Days
View Larger Image
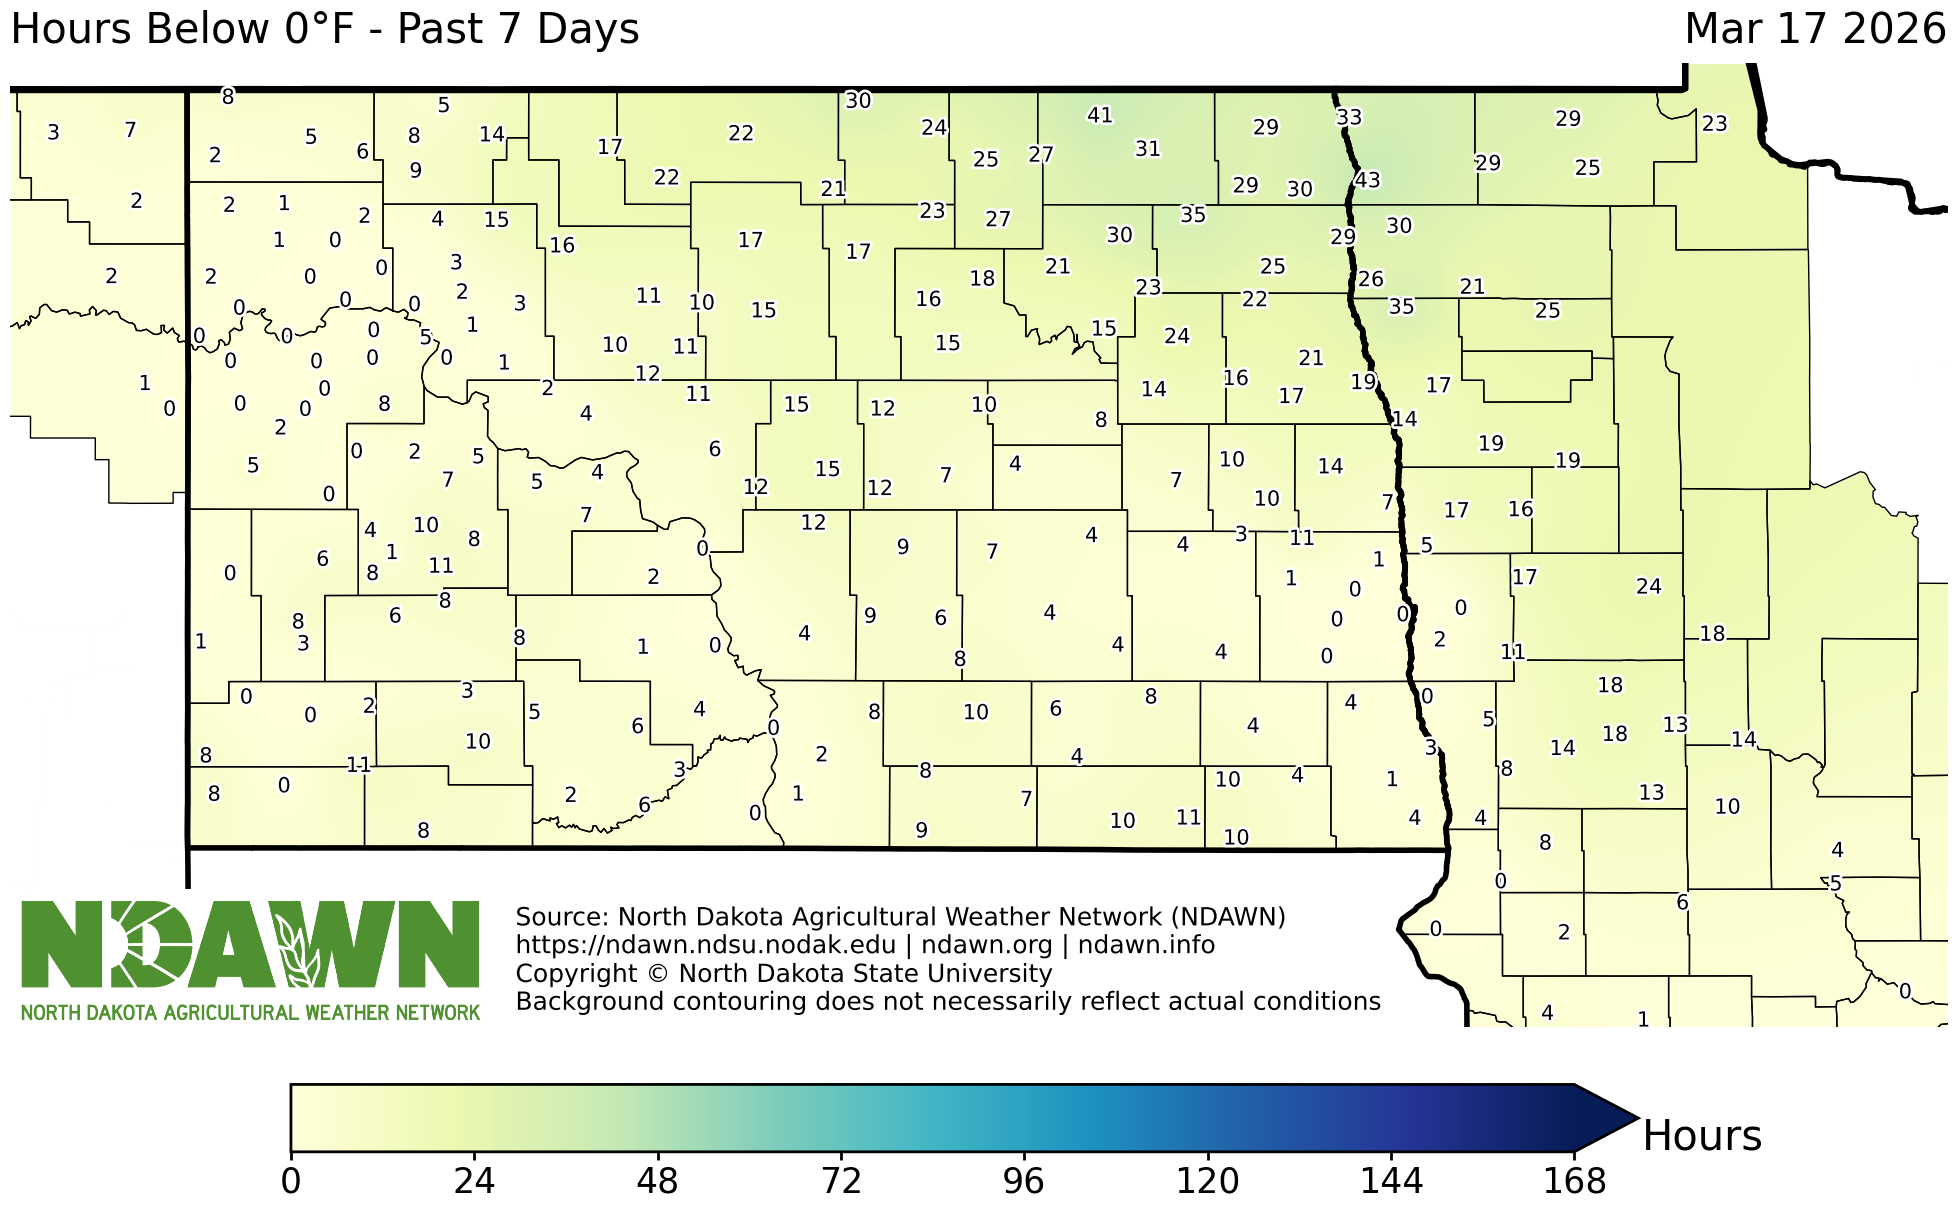
Total Hours Below 0°F - Past 7 Days
View Larger Image
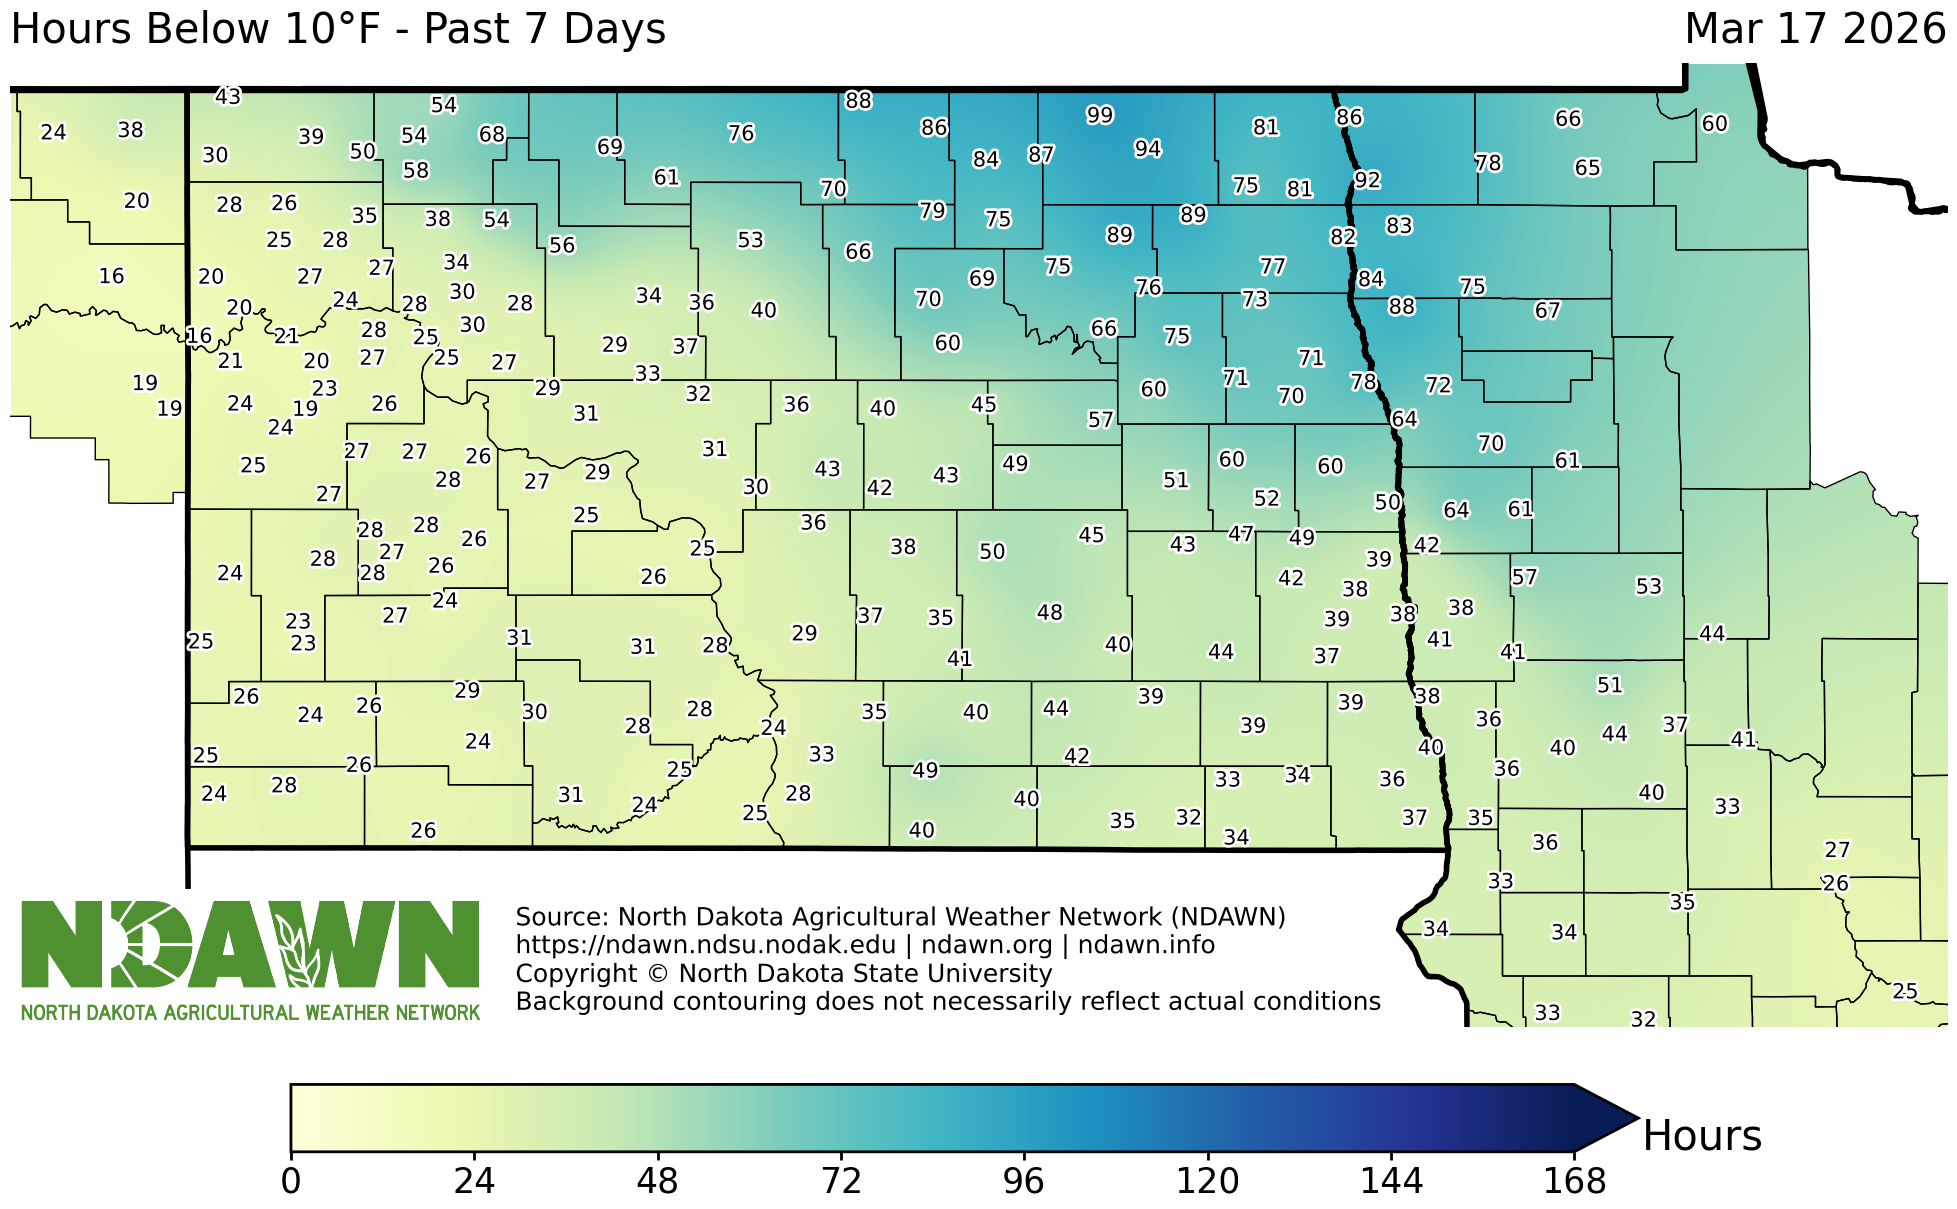
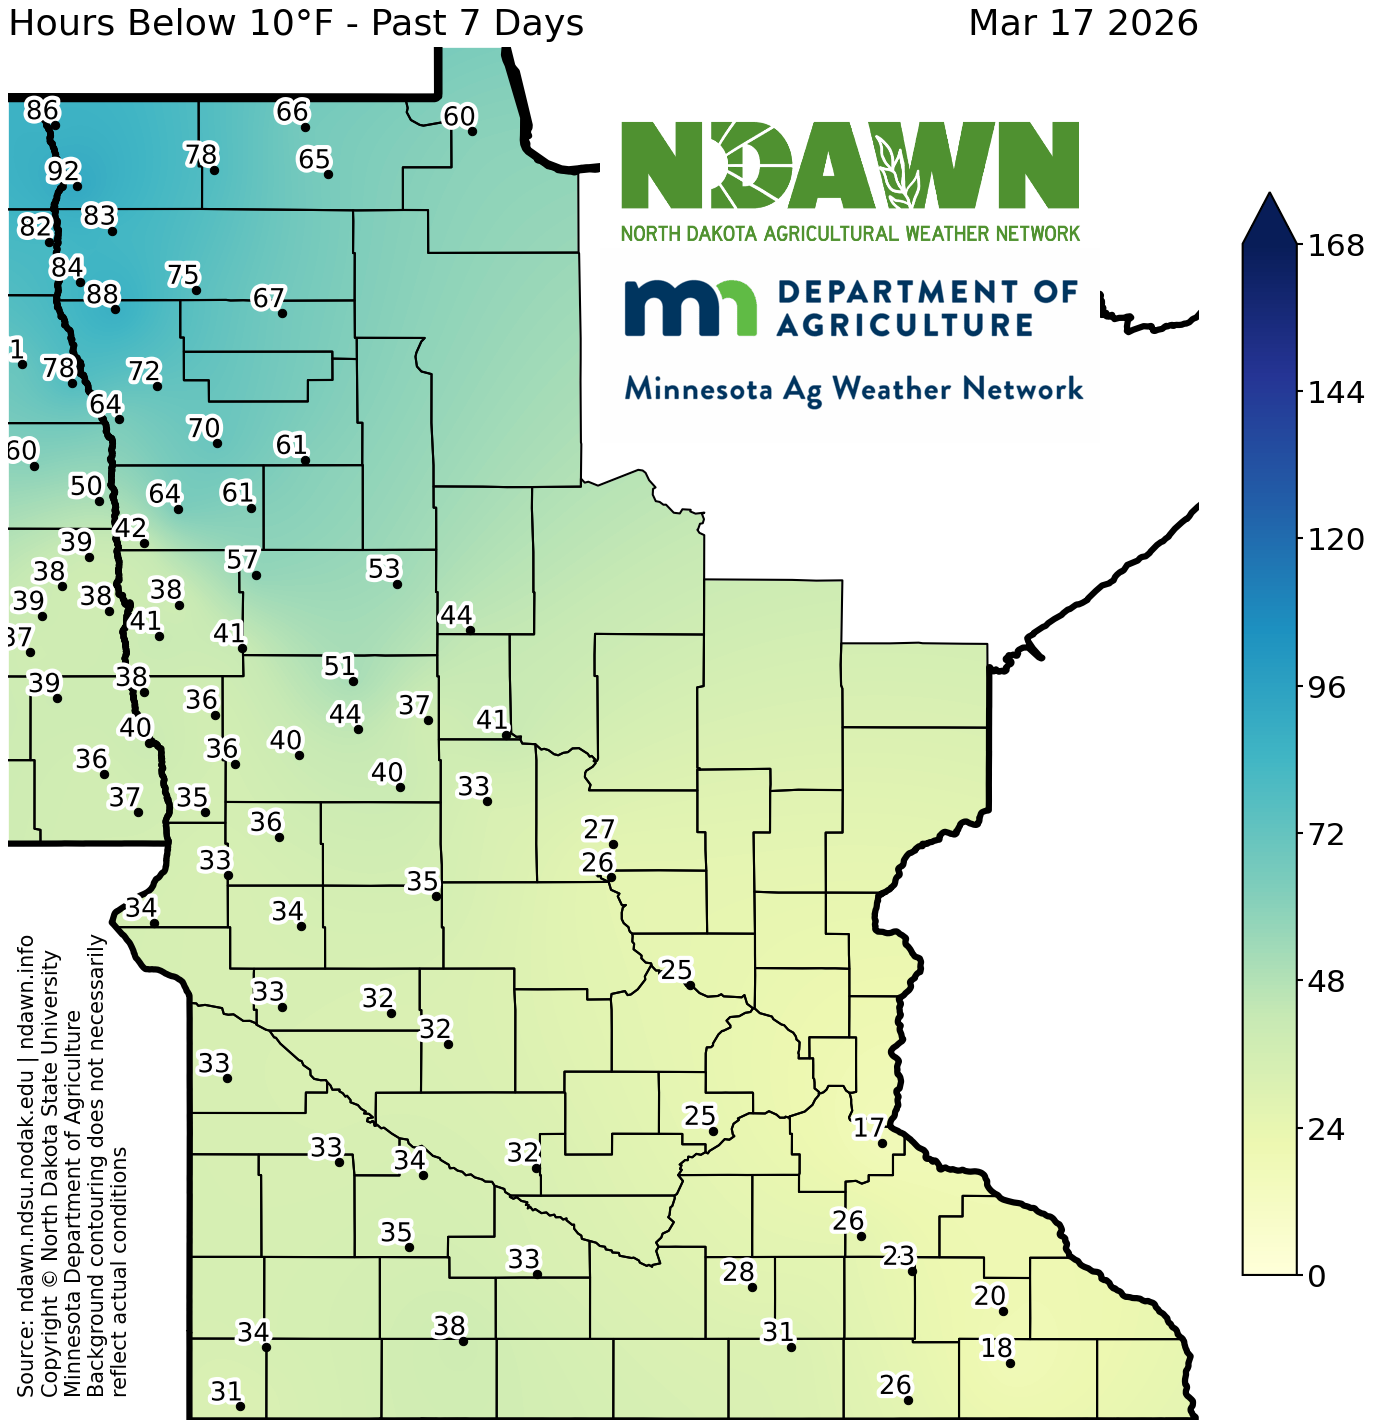
Total Hours Below 10°F - Past 7 Days
View Larger Image
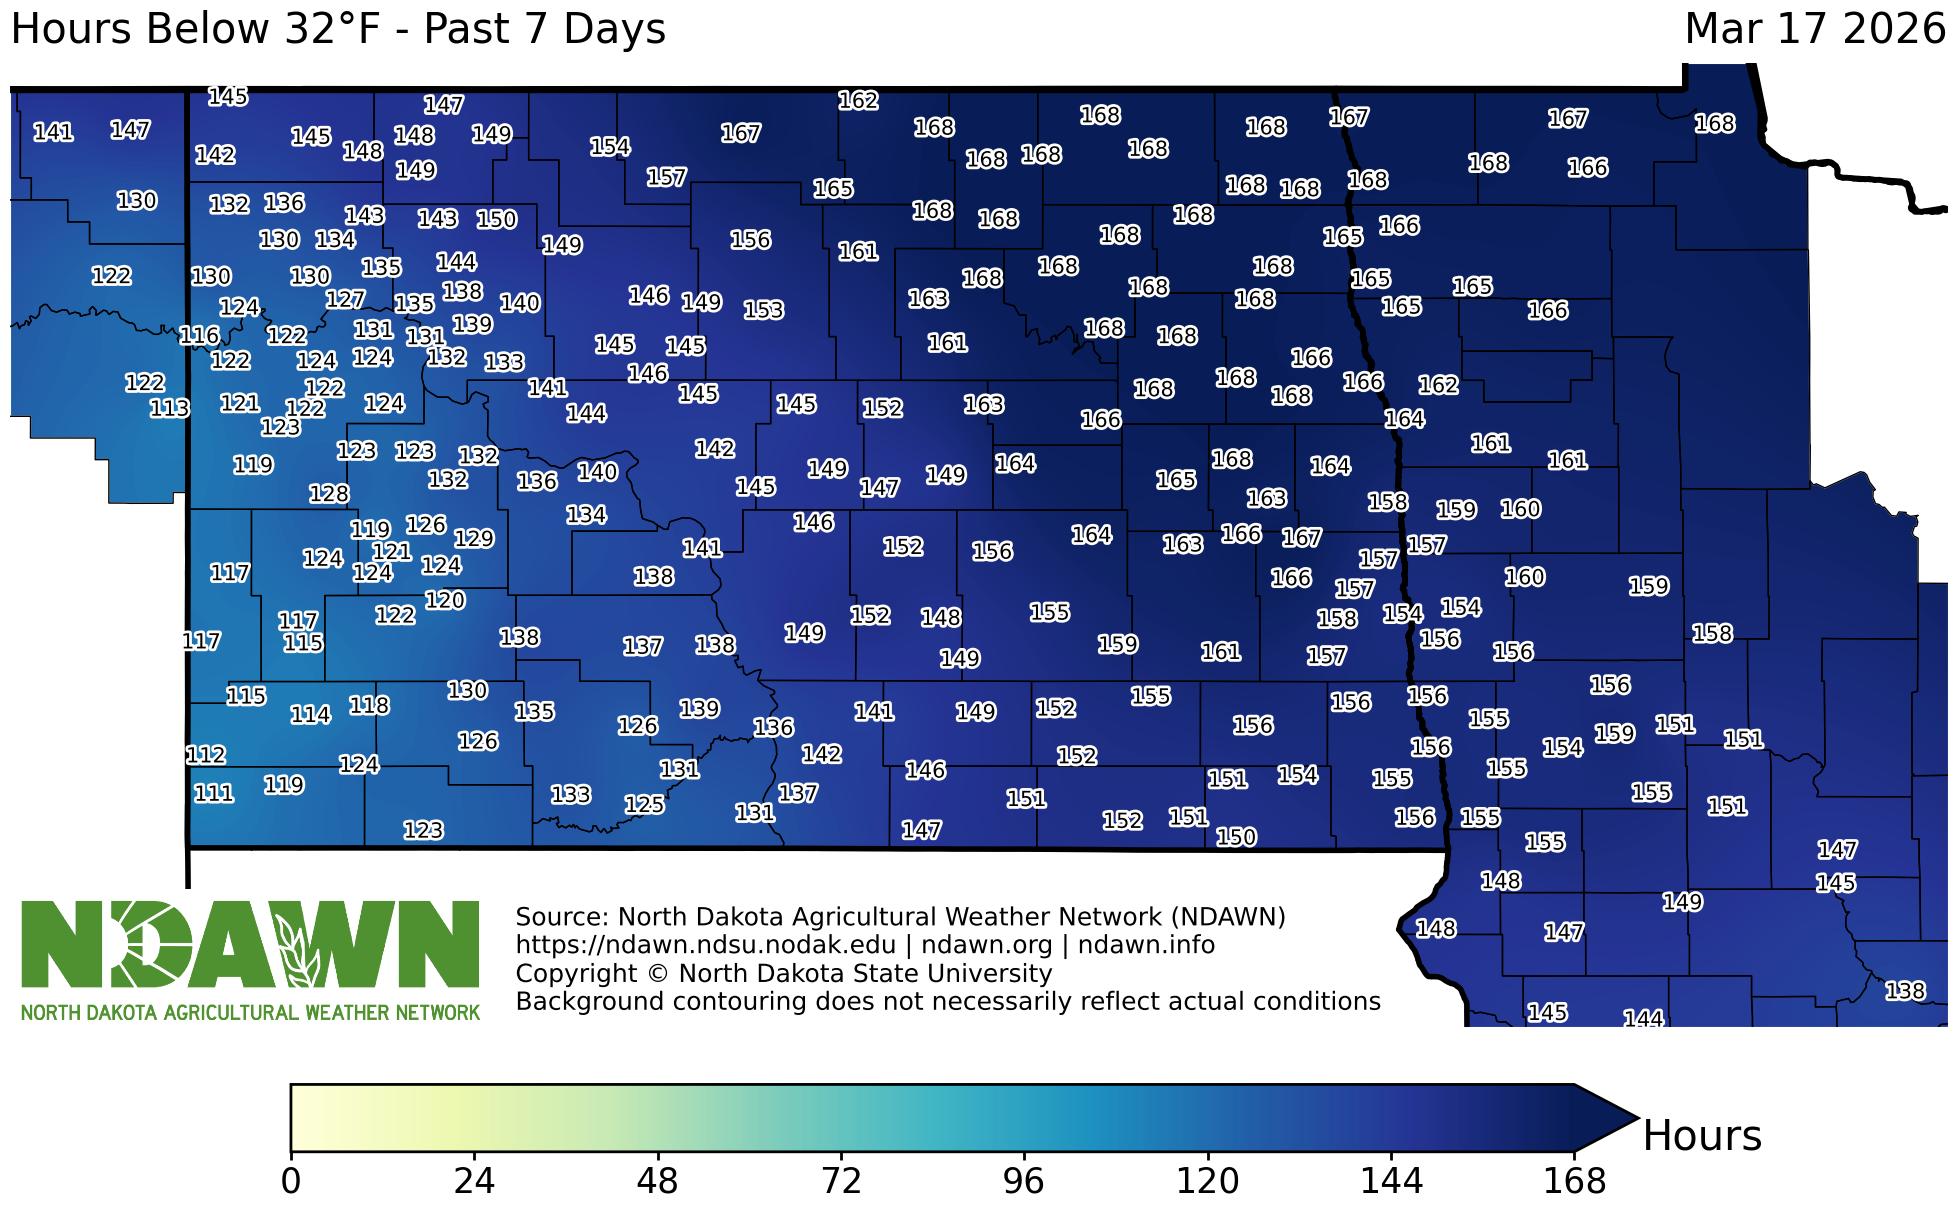
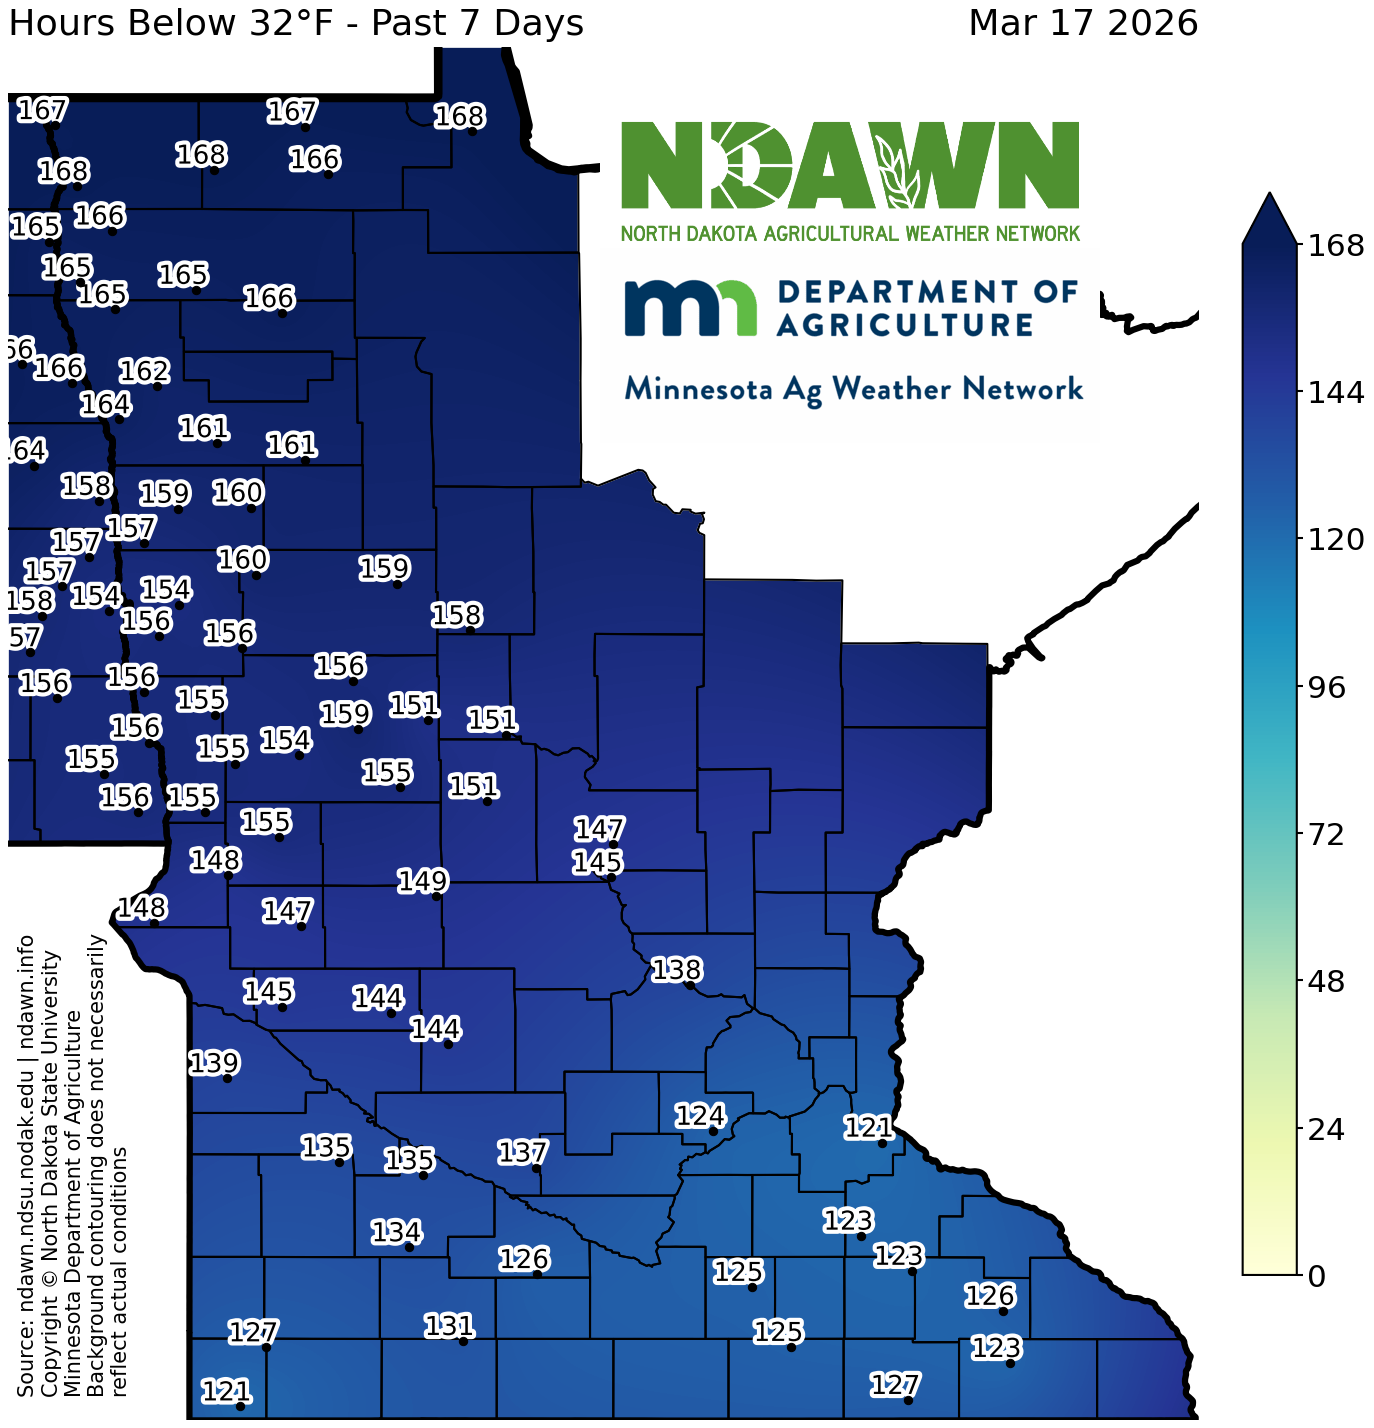
Total Hours Below 32°F - Past 7 Days
View Larger Image
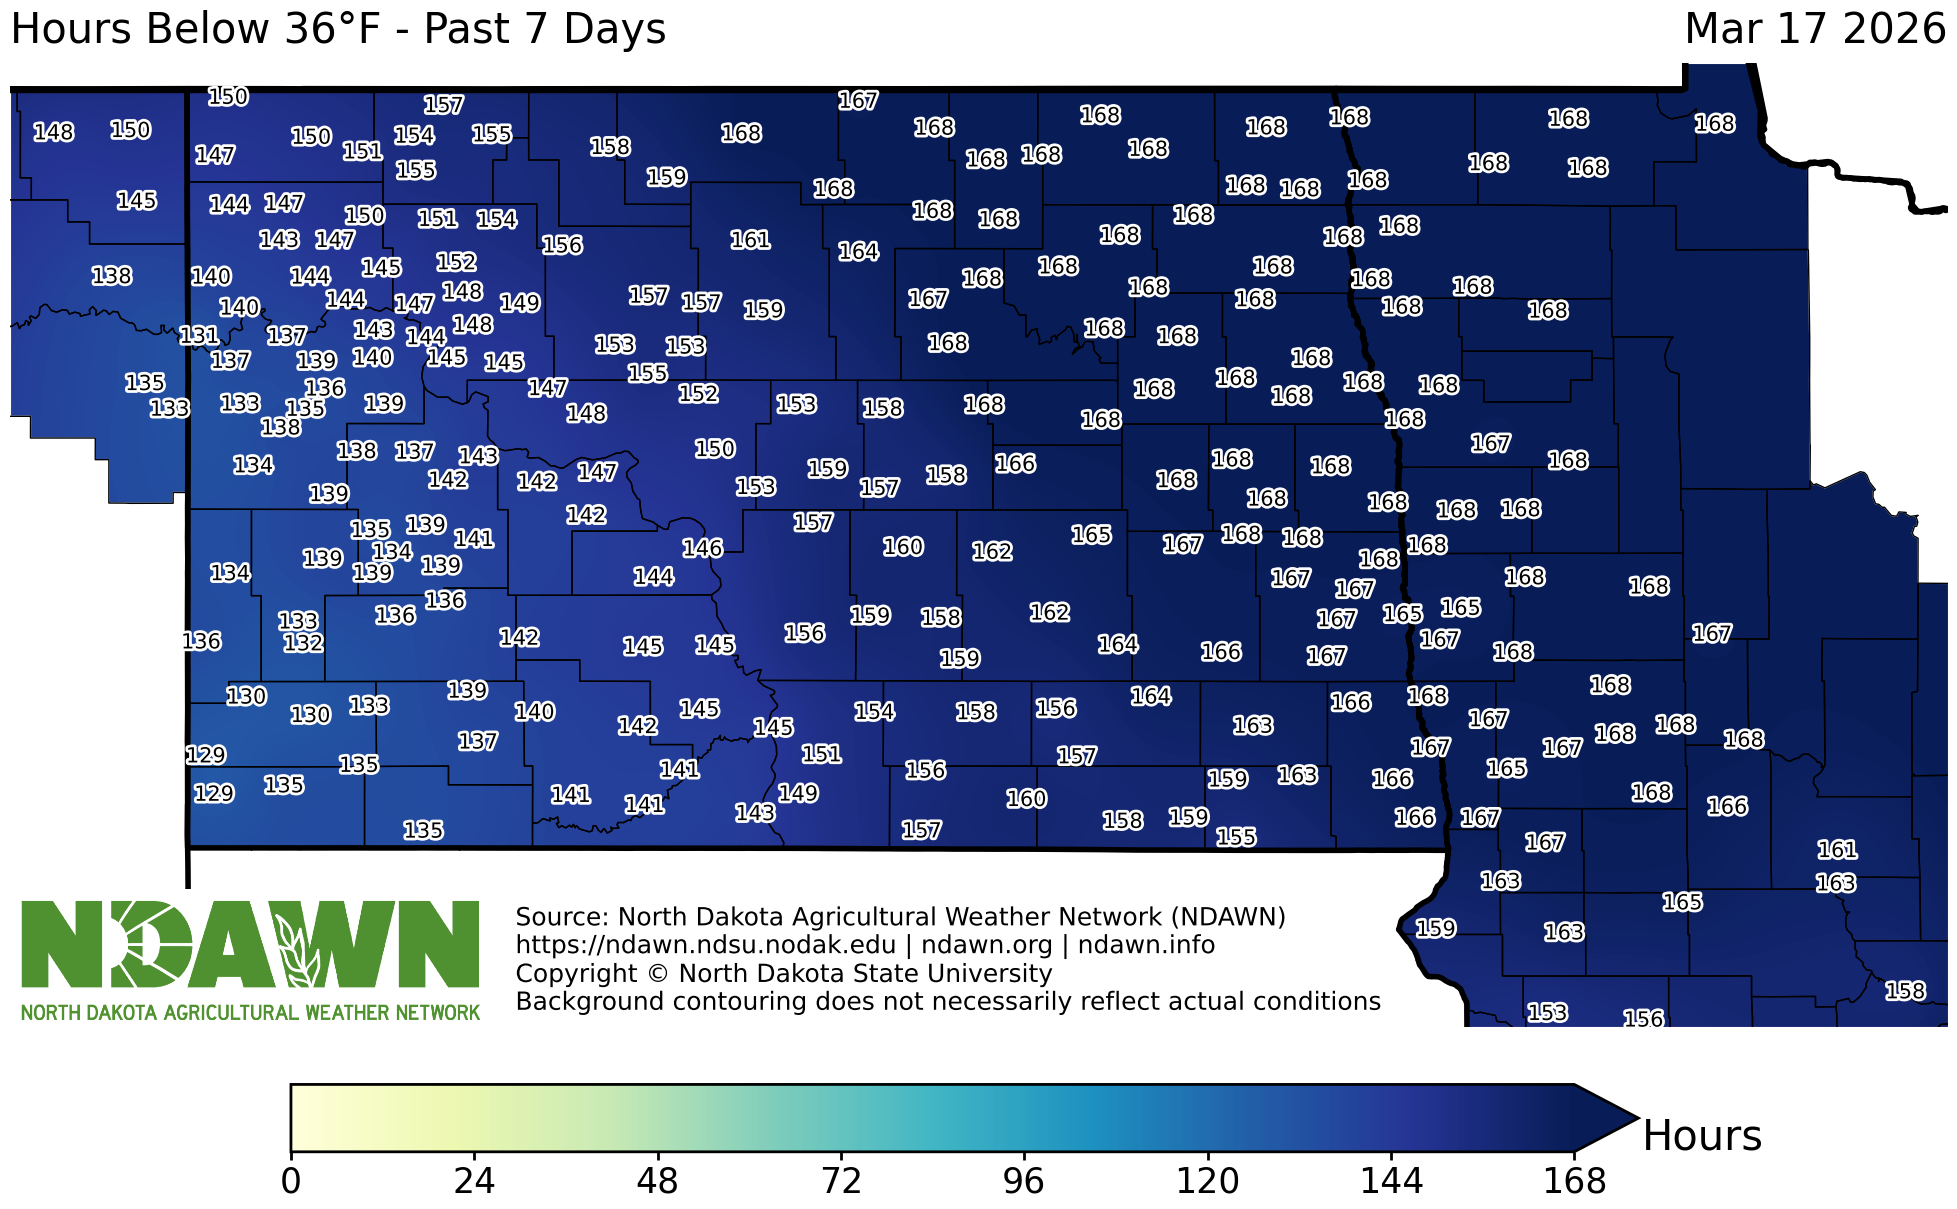
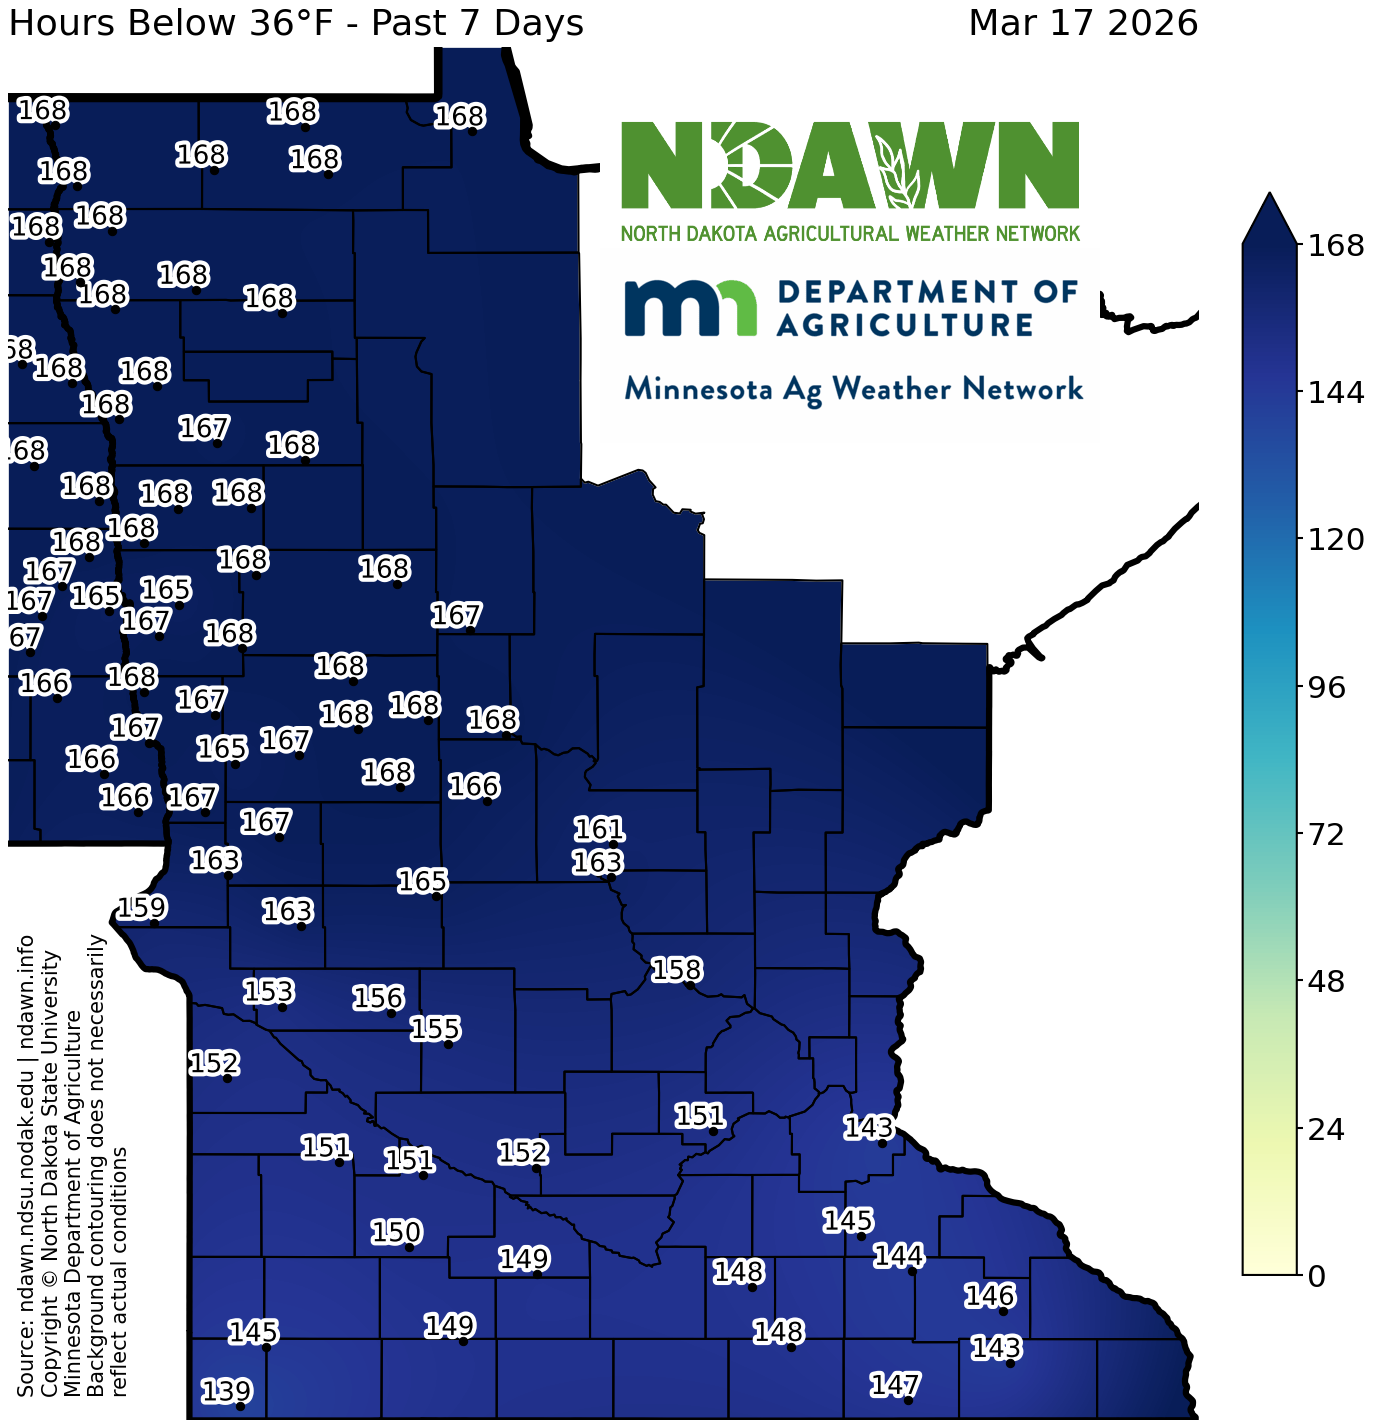
Total Hours Below 36°F - Past 7 Days
View Larger Image
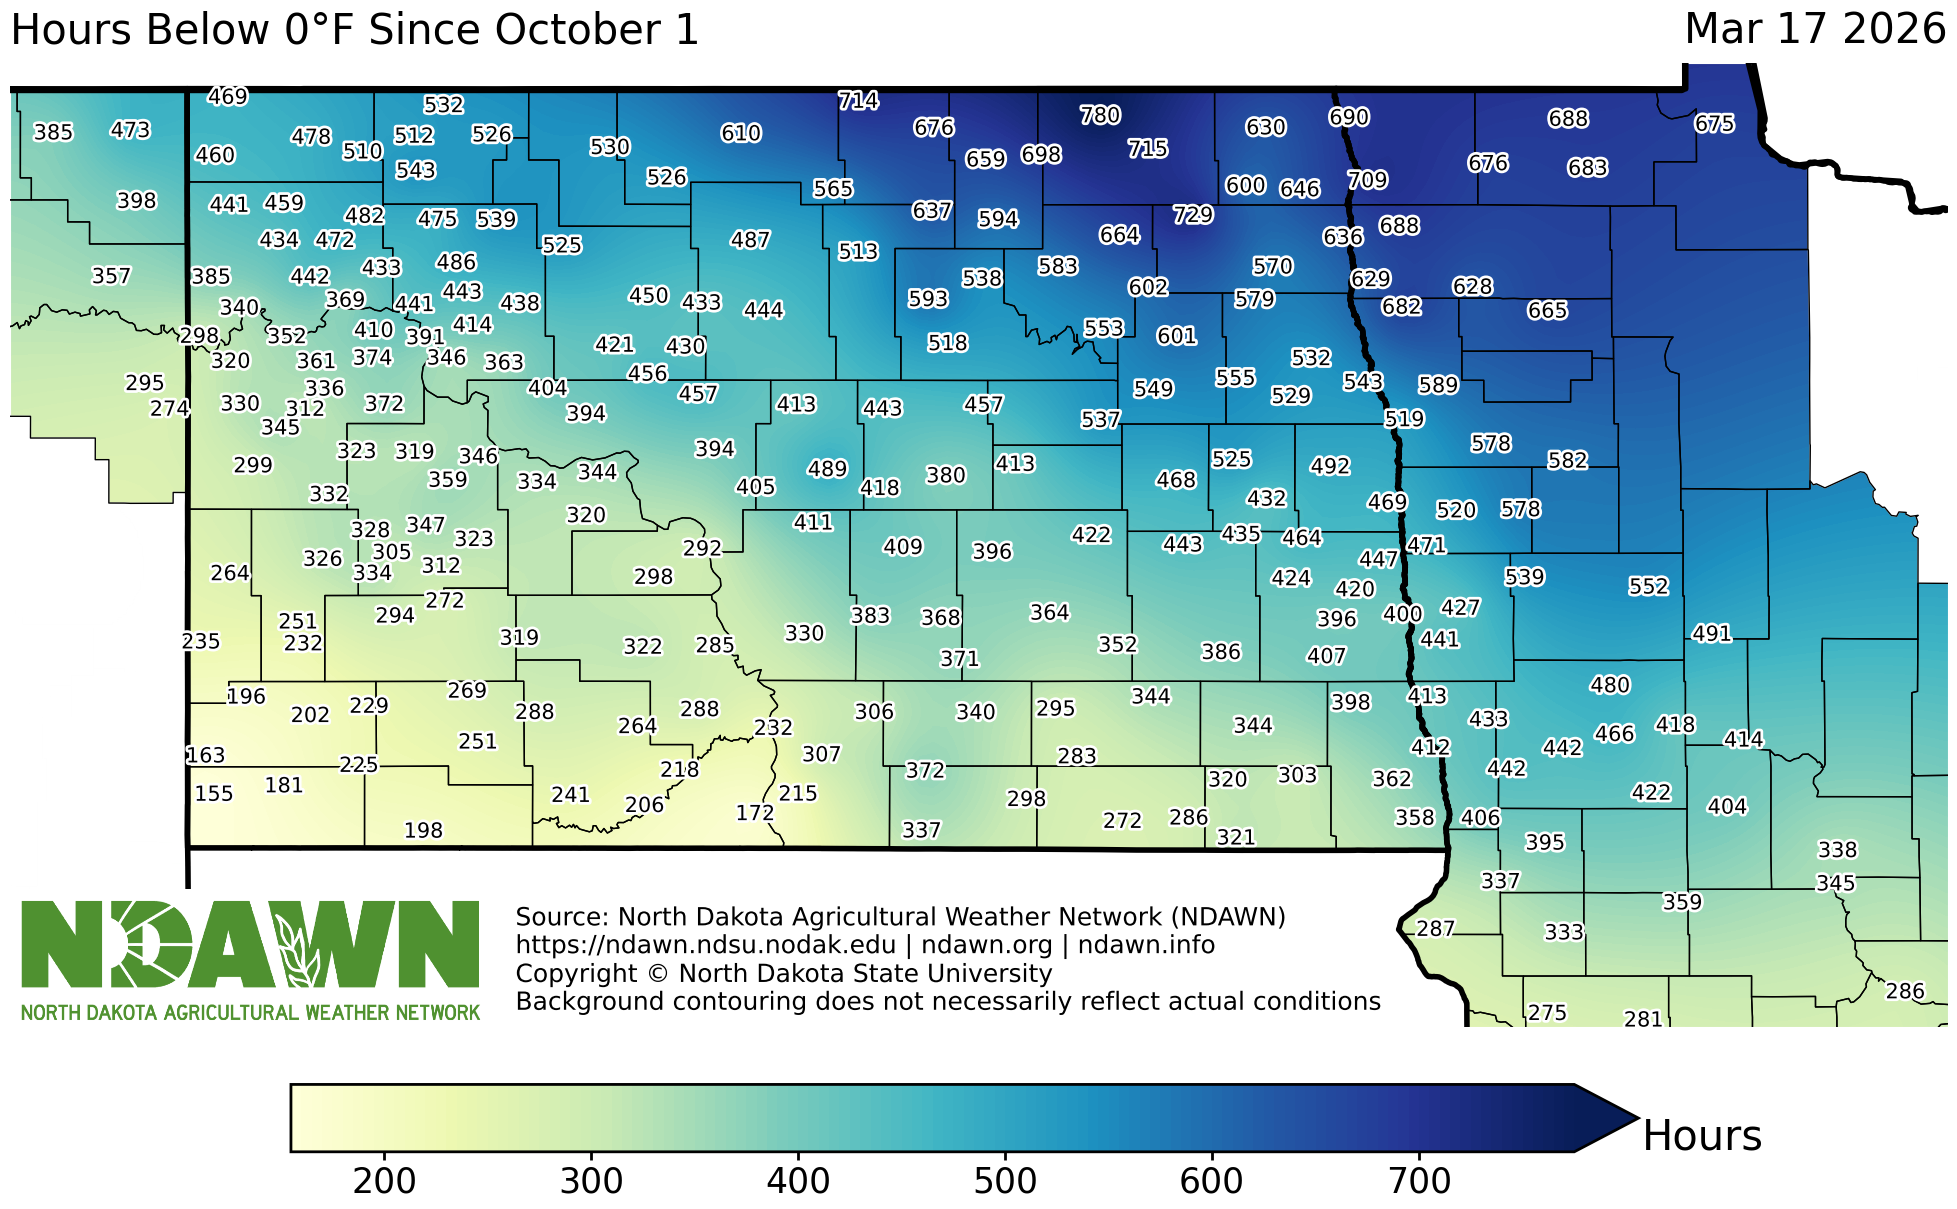
Total Hours Below 0°F - Since Oct 1
View Larger Image
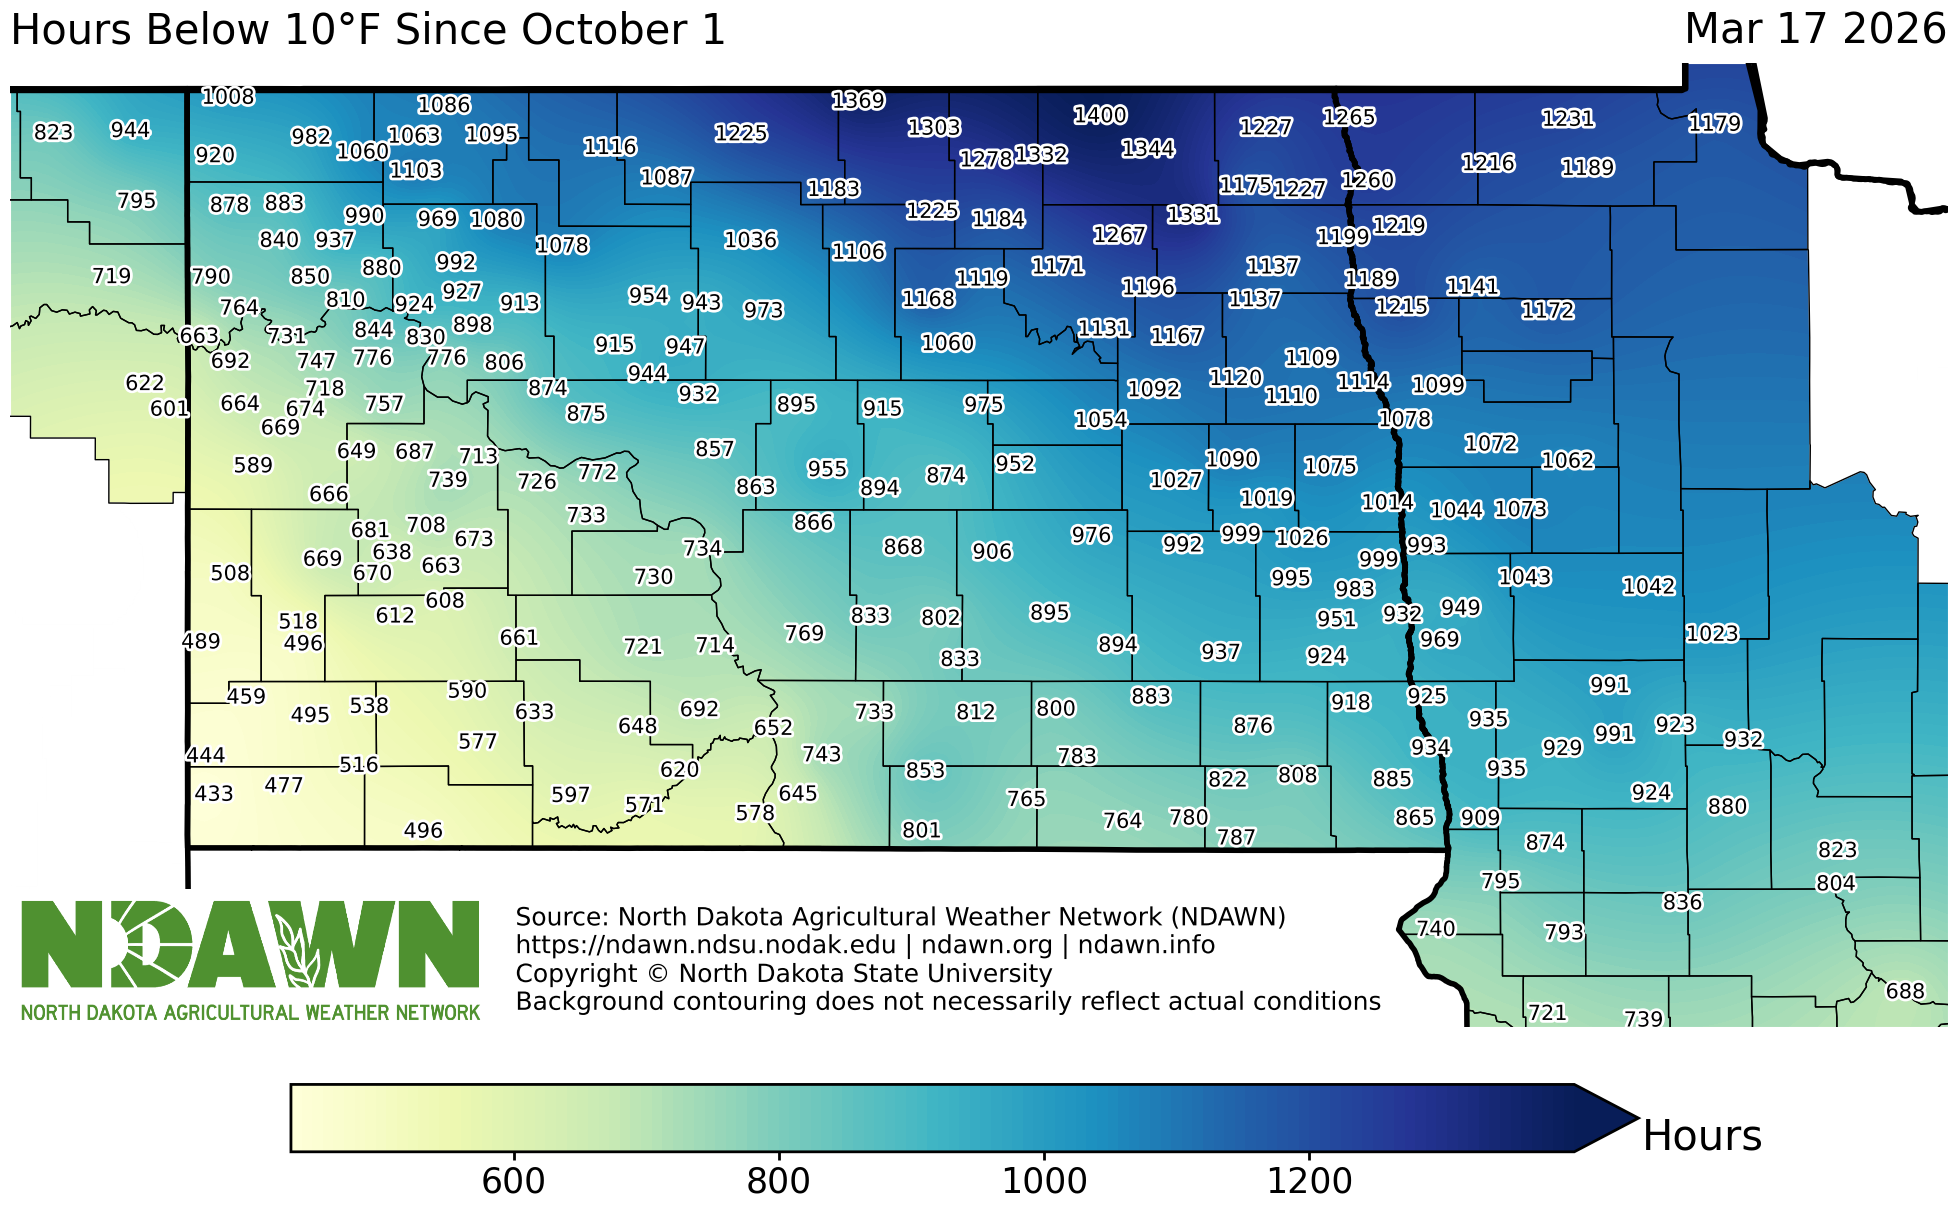
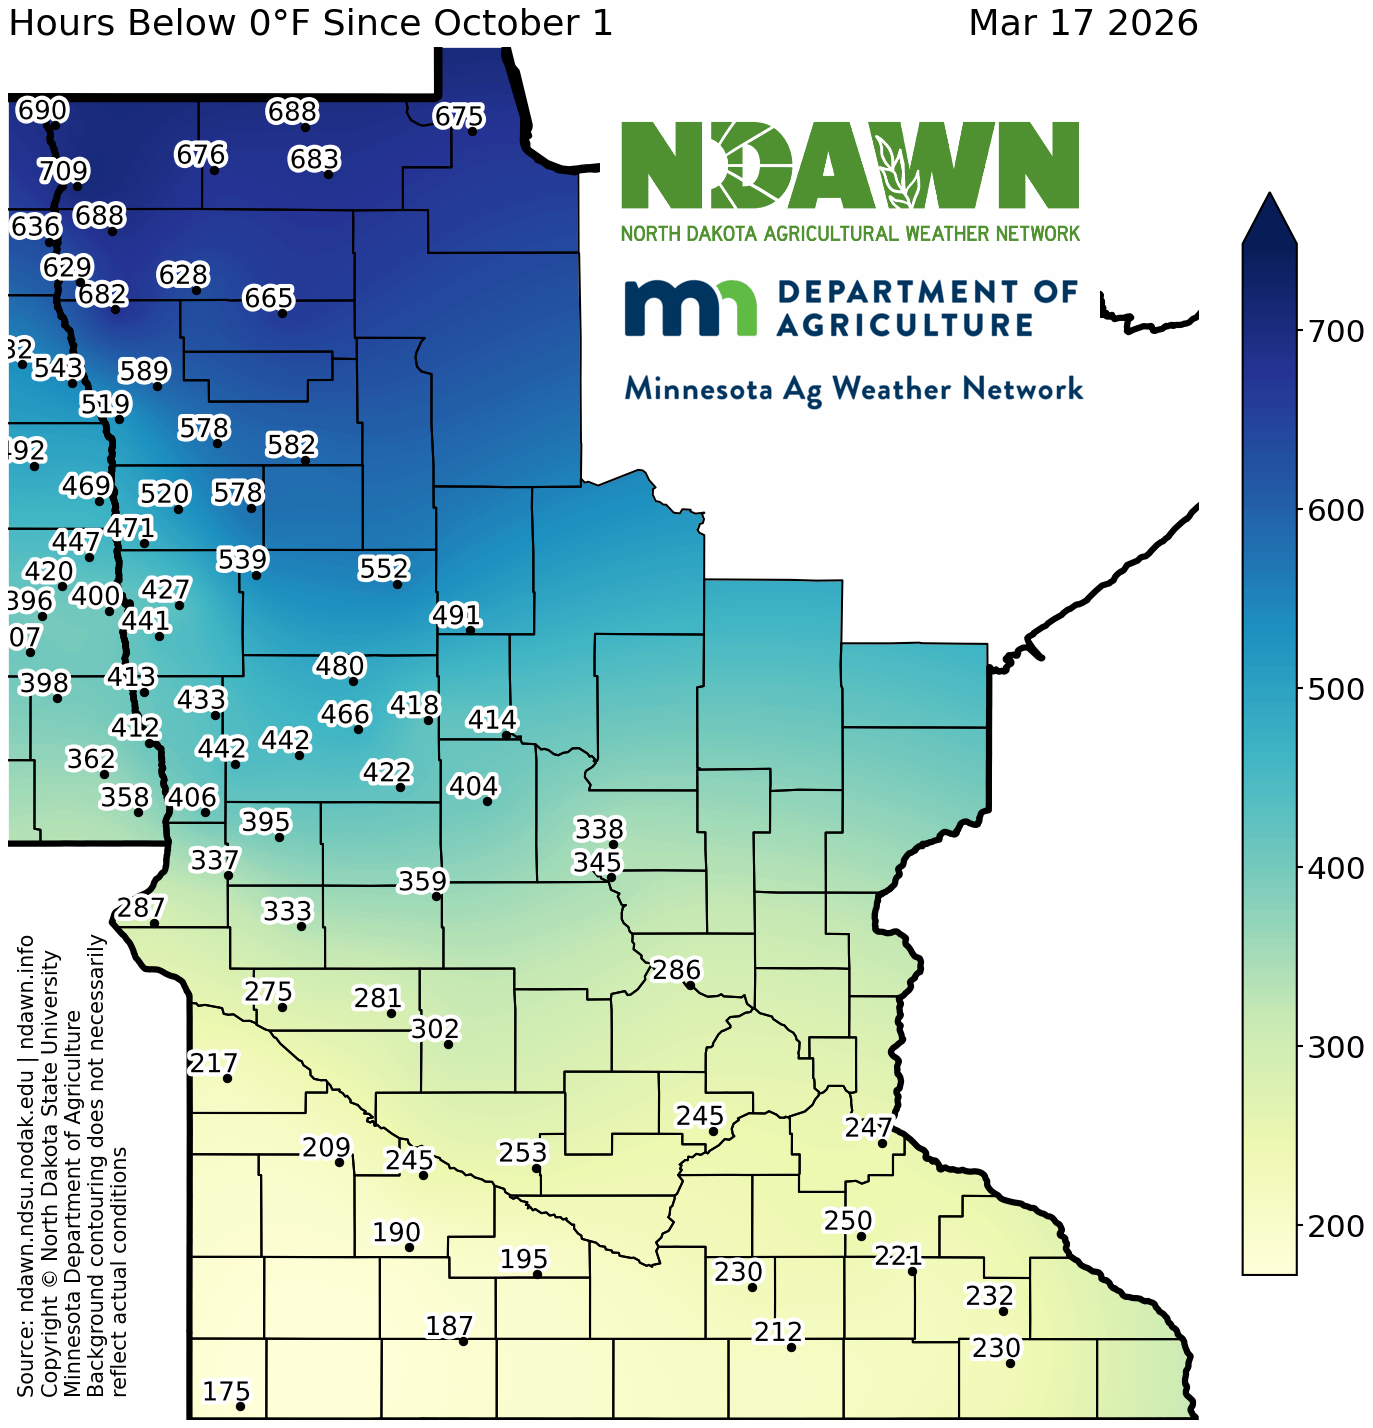
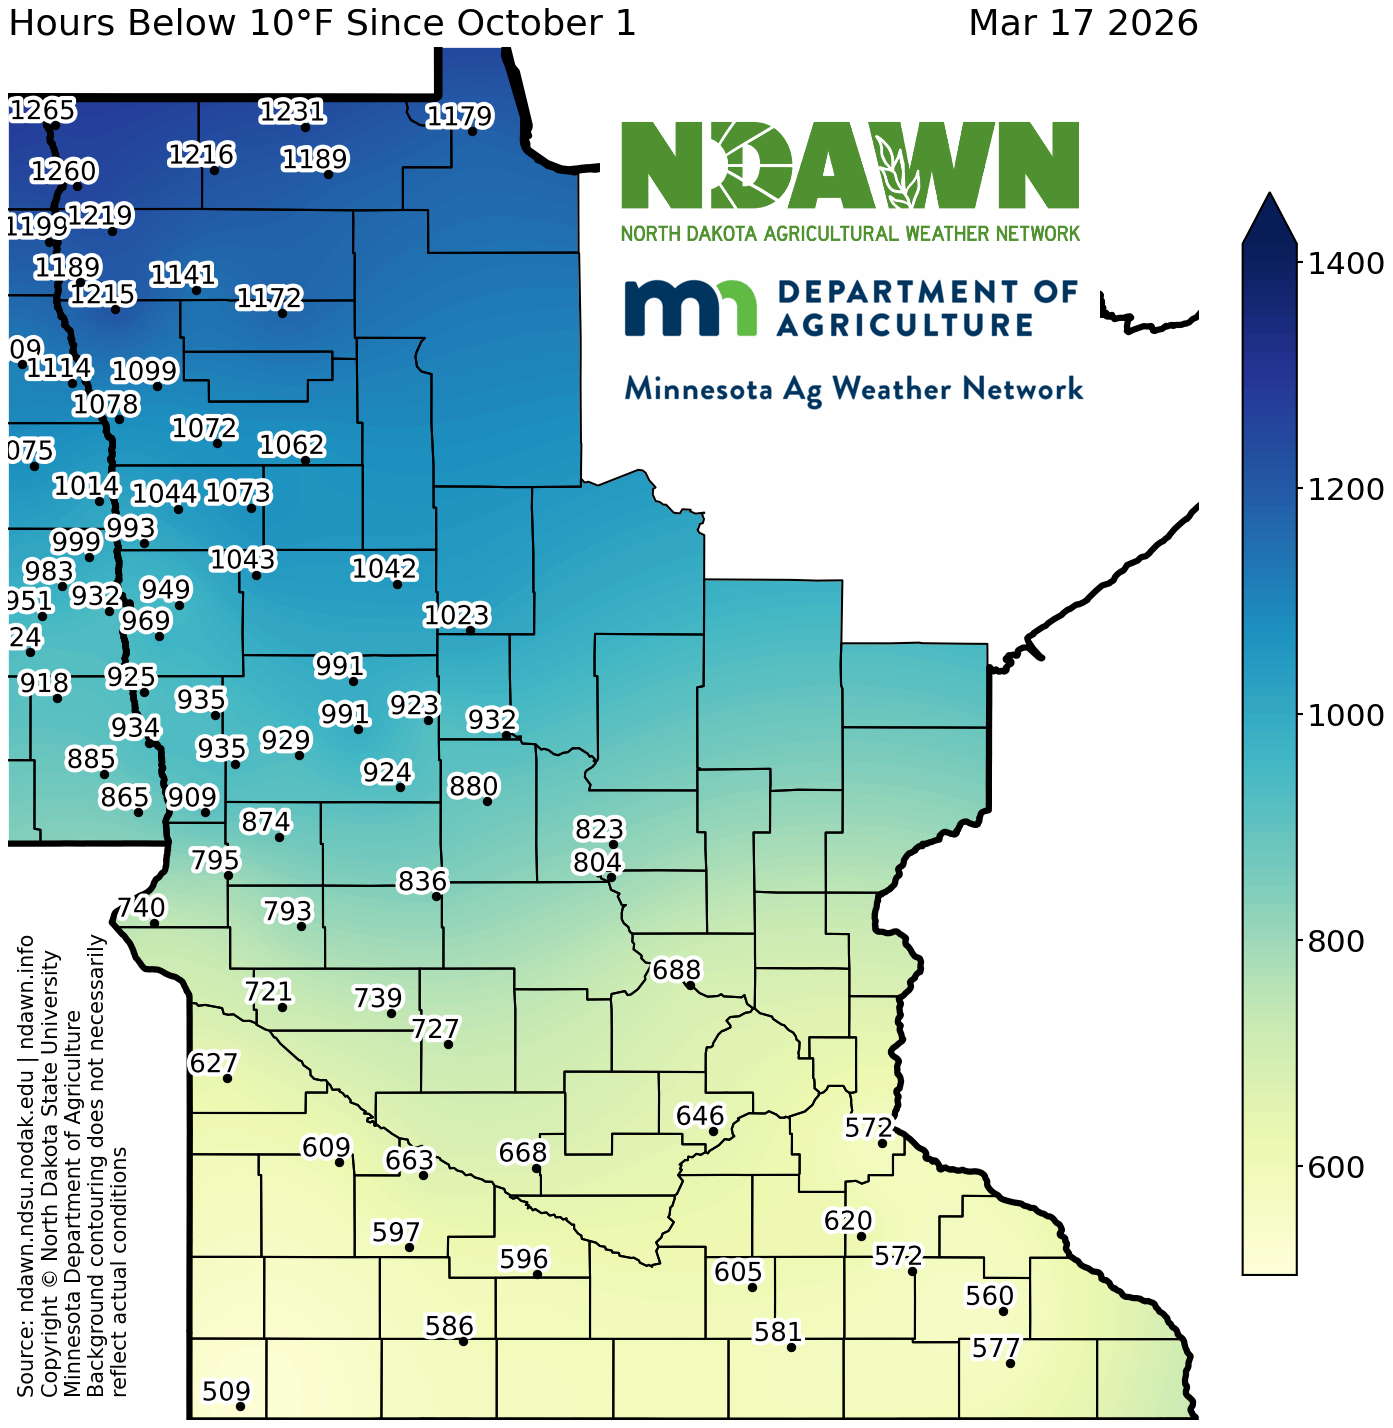
Total Hours Below 10°F - Since Oct 1
View Larger Image
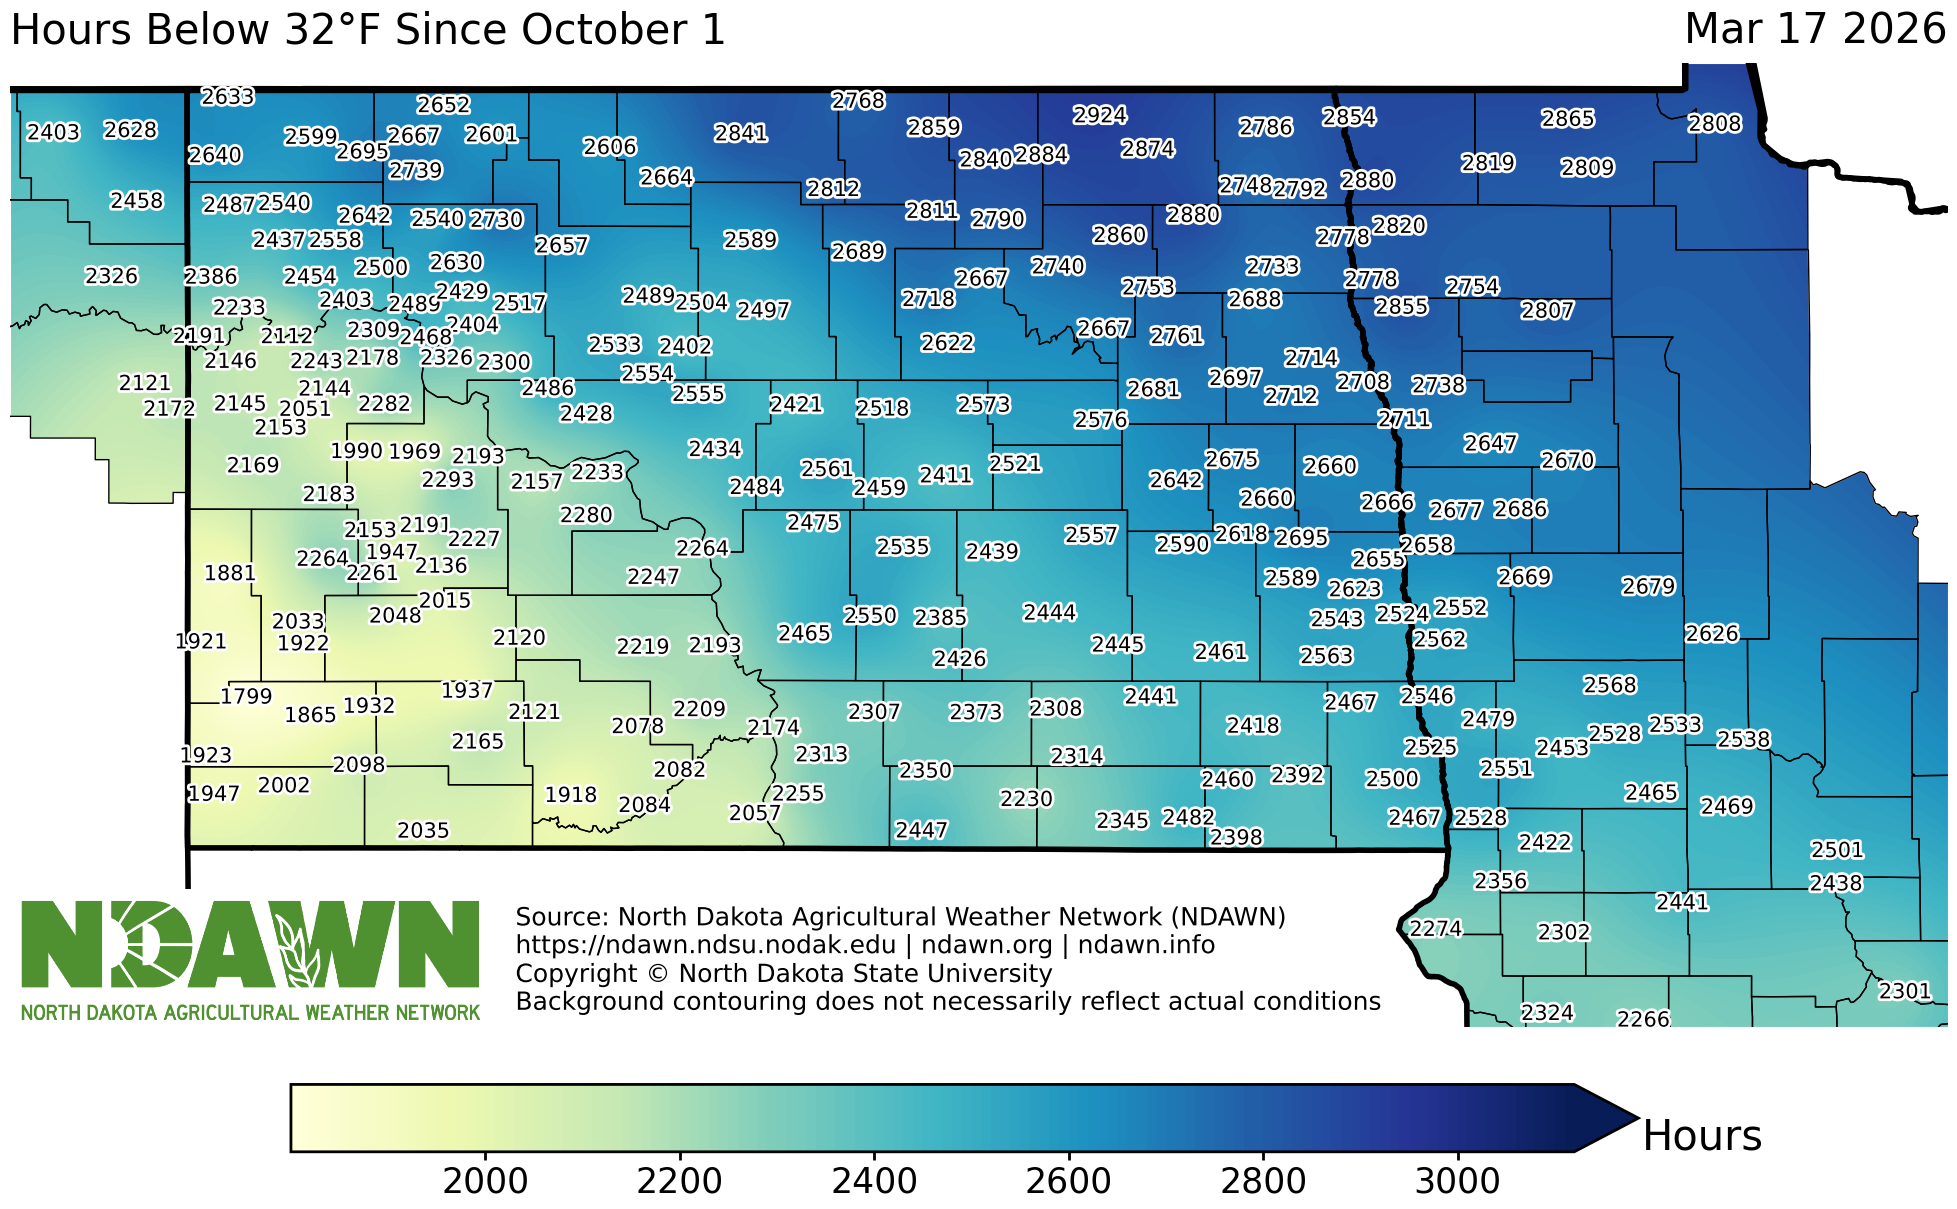
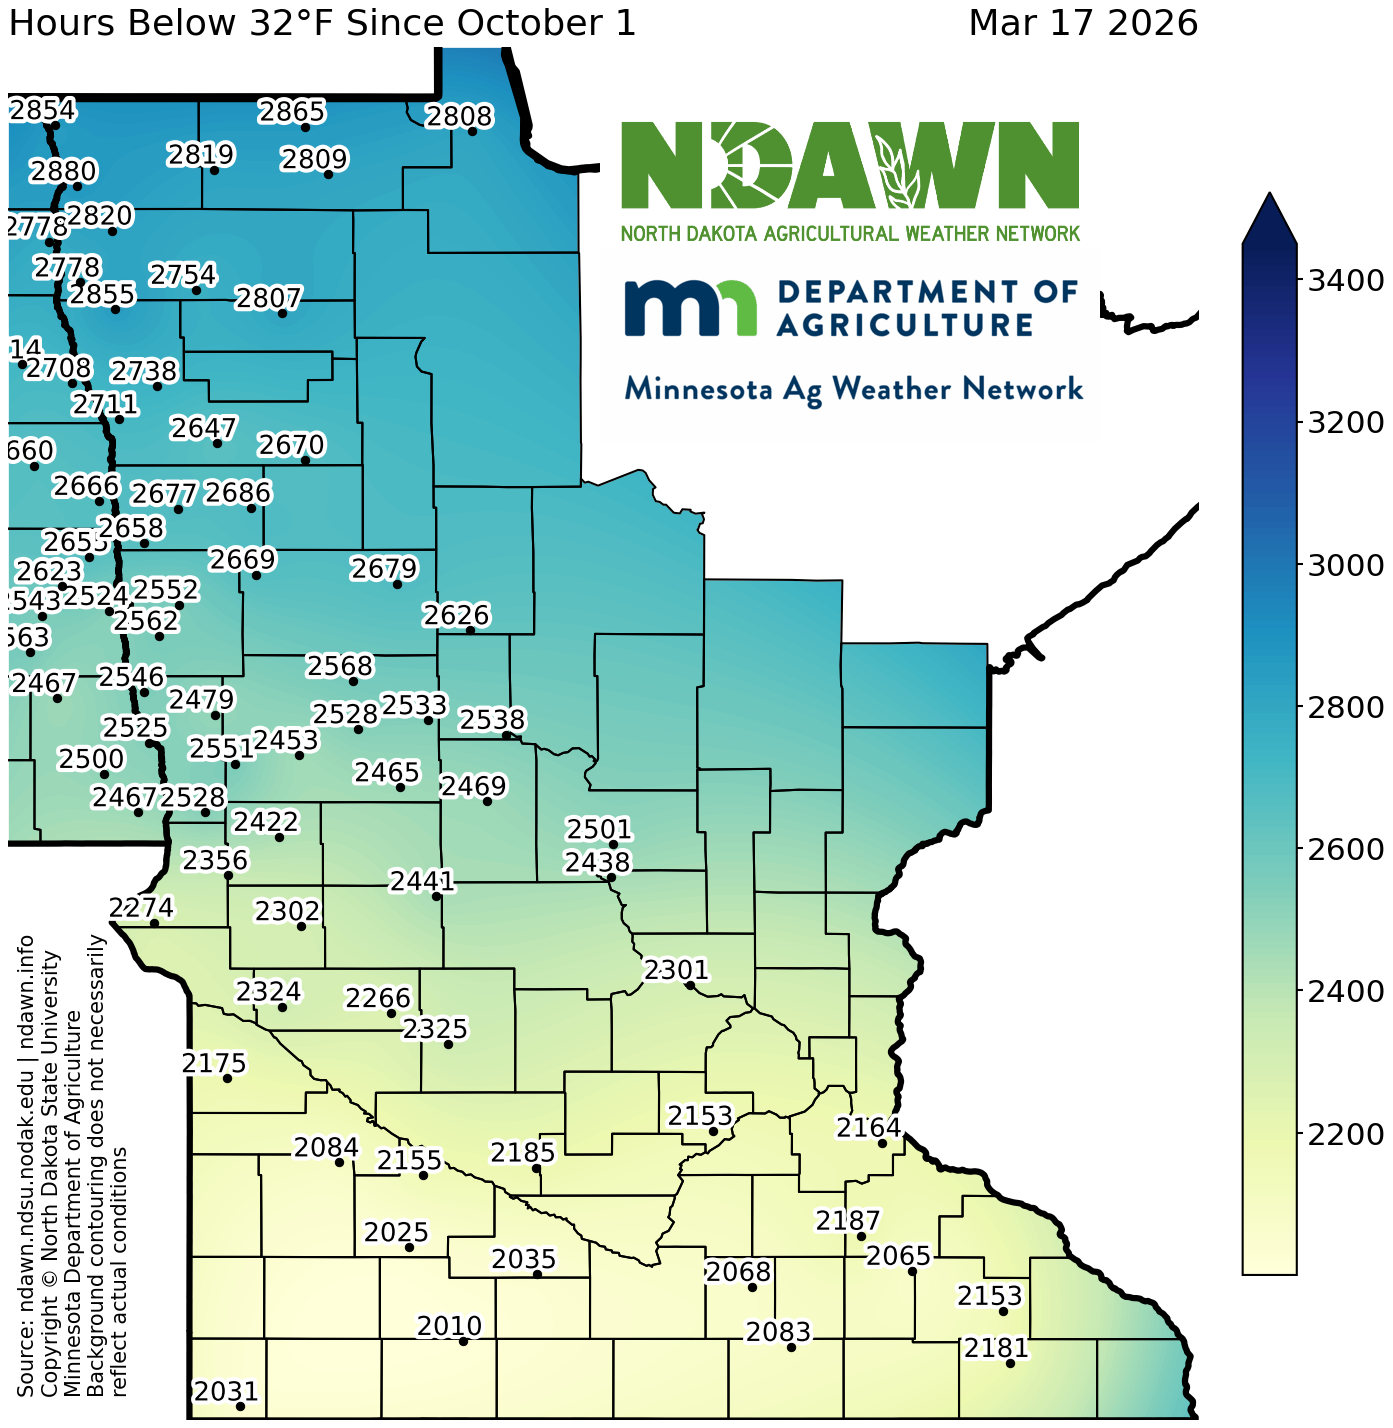
Total Hours Below 32°F - Since Oct 1
View Larger Image
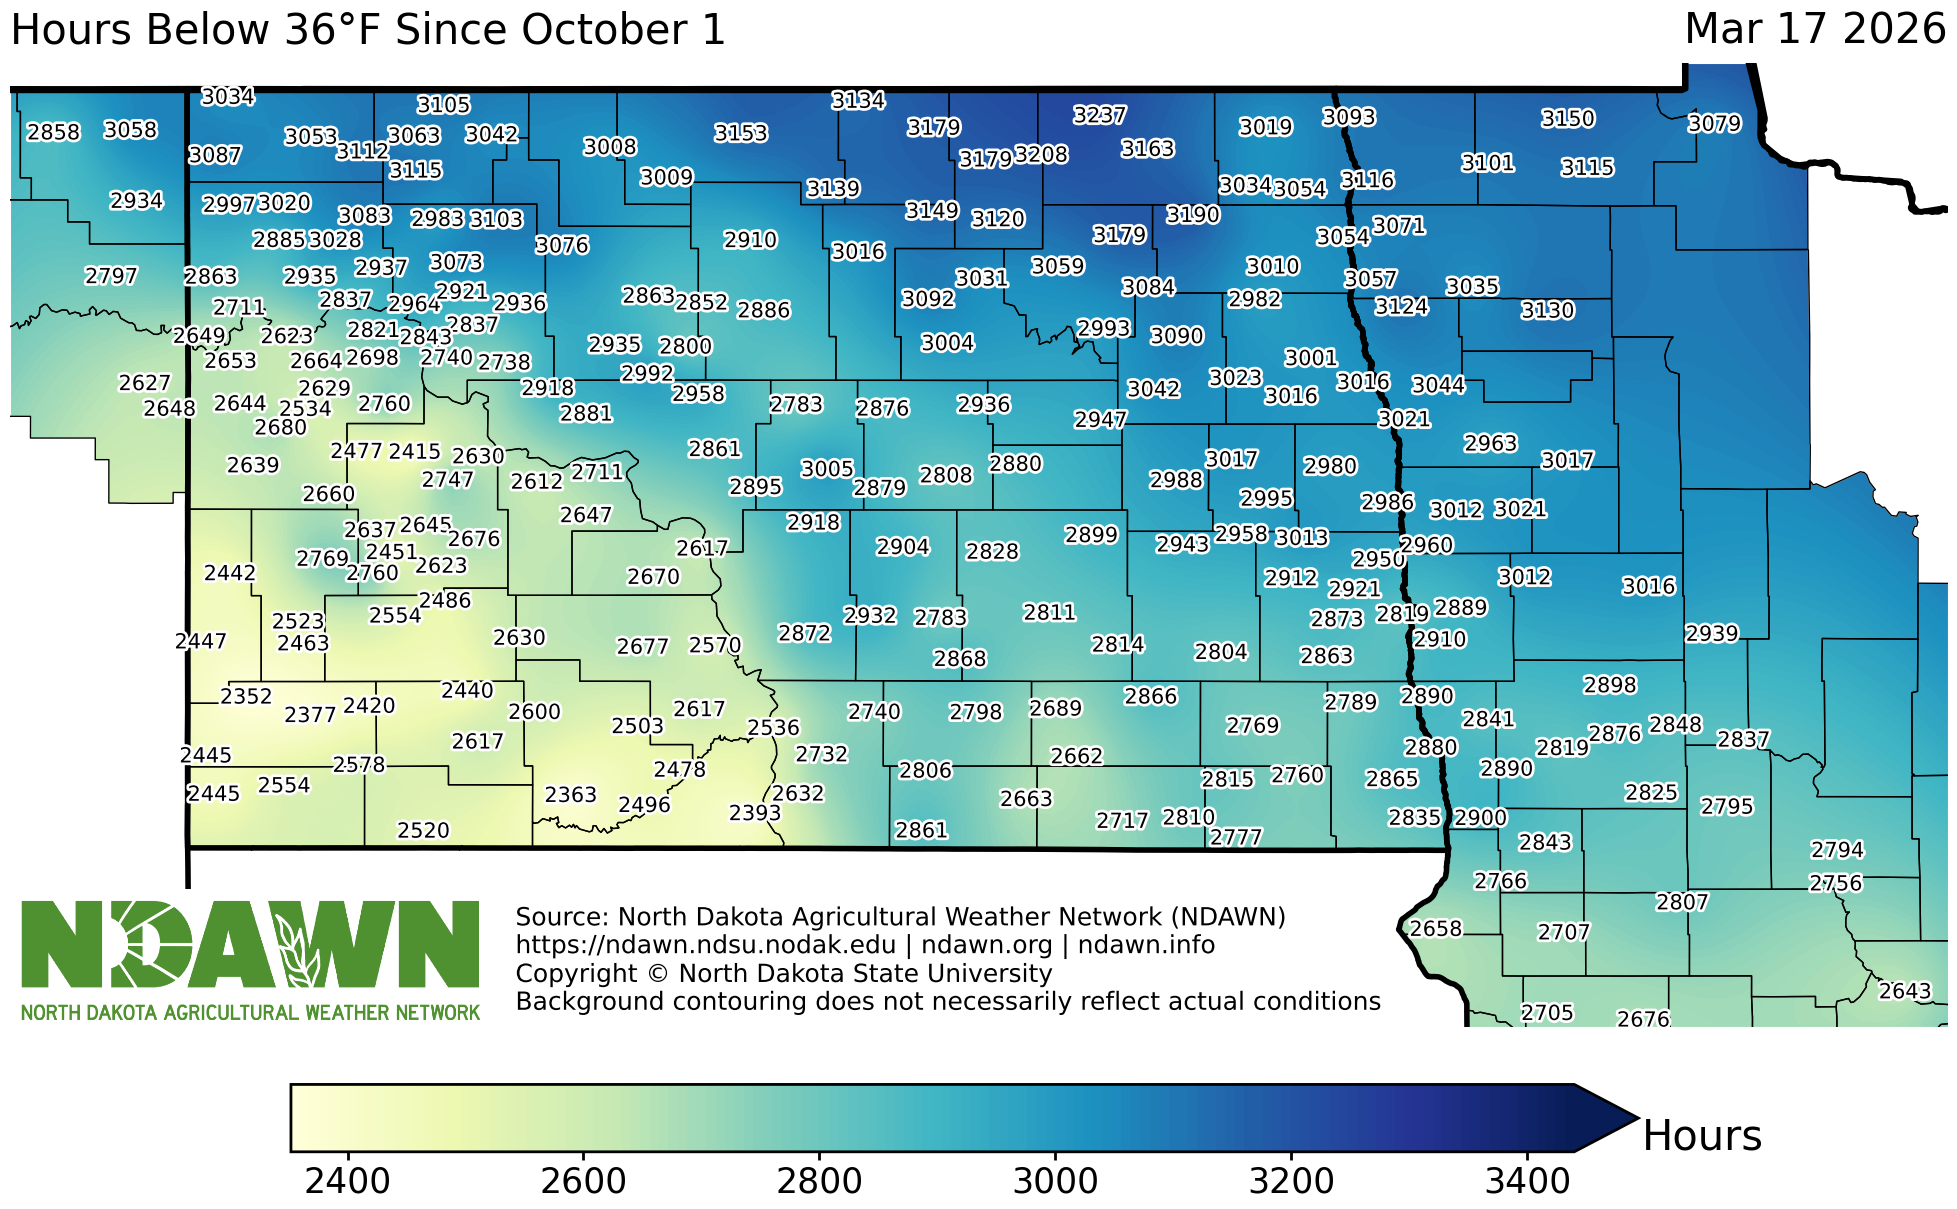
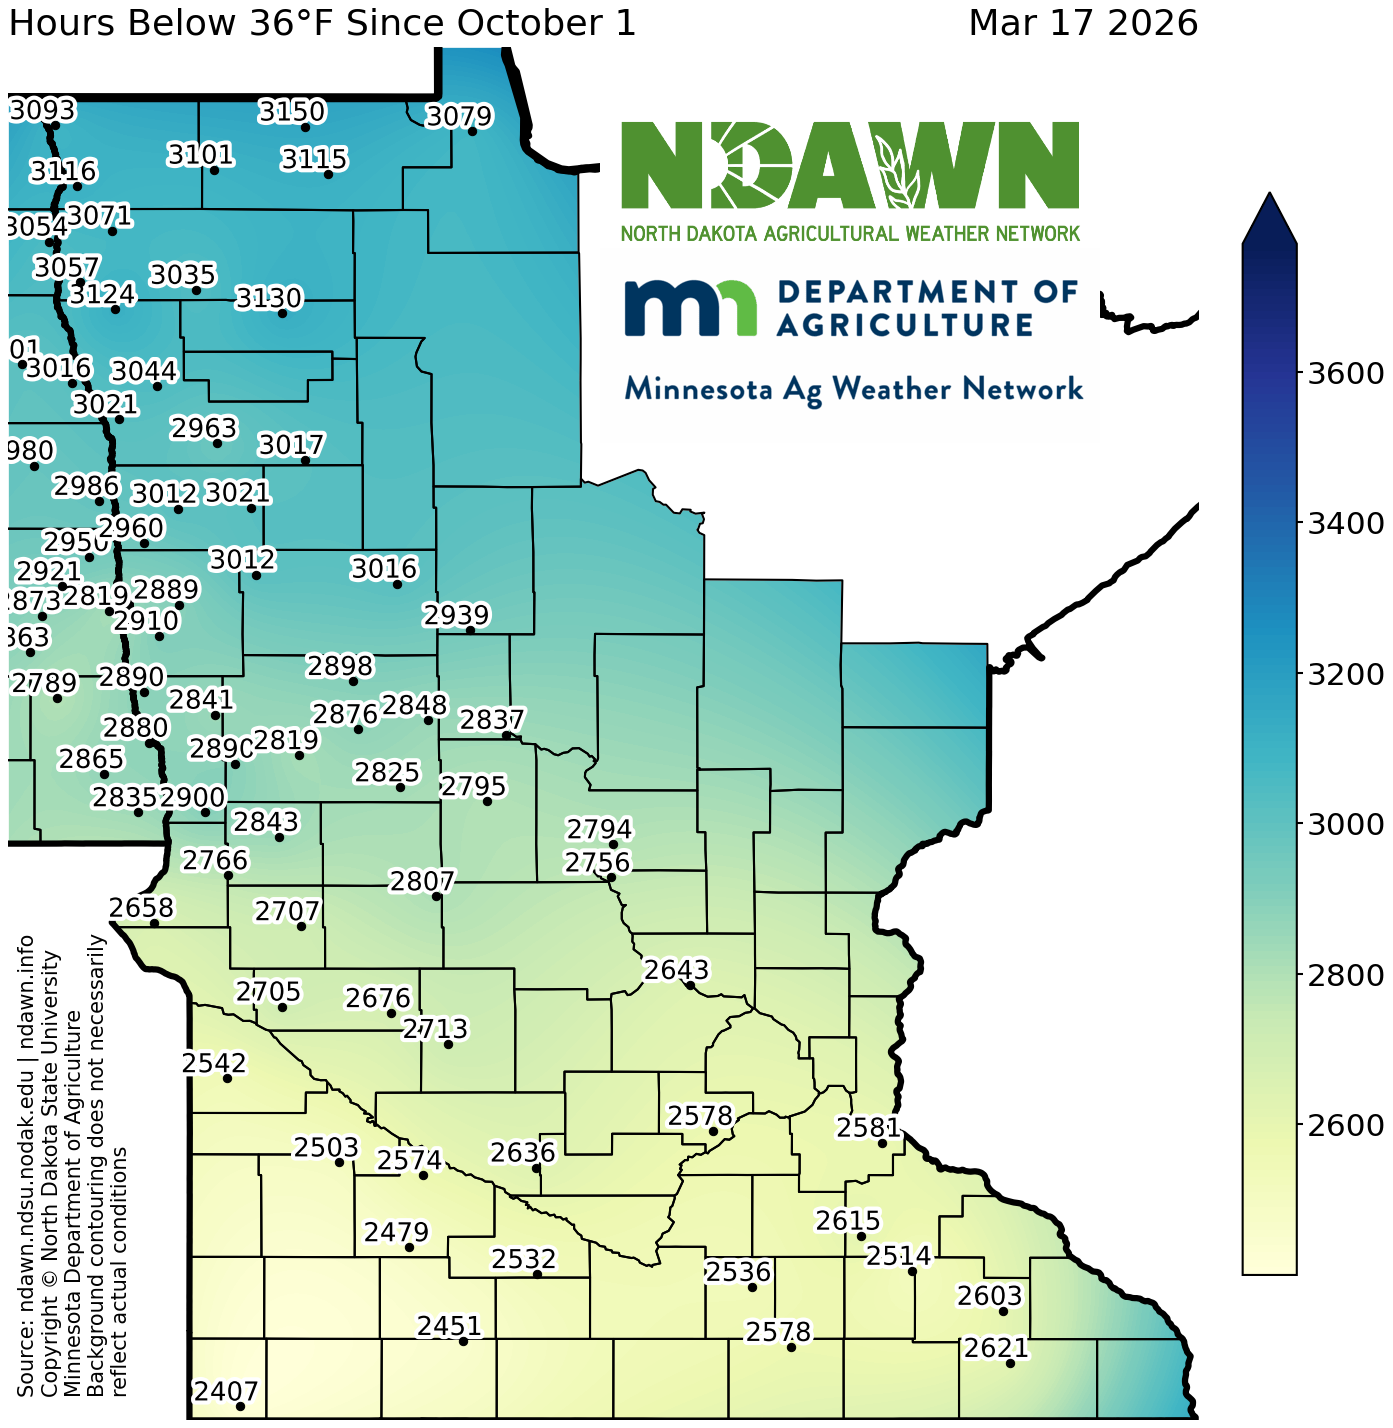
Total Hours Below 36°F - Since Oct 1
View Larger Image
Average Temperatures
Average Temperature - Past 3 Days
View Larger Image
Average Temperature - Past 5 Days
View Larger Image
Average Temperature - Past 7 Days
View Larger Image
Average Temperature - Past 10 Days
View Larger Image
Average Temperature - Past 14 Days
View Larger Image
Average Temperature - Past 30 Days
View Larger Image
Average Temperature - Past 60 Days
View Larger Image
Average Temperature - Current Month
View Larger Image
Average Temperature - Since January 1, 2026
View Larger Image
Average Temperature - Since May 1, 2026
View Larger Image
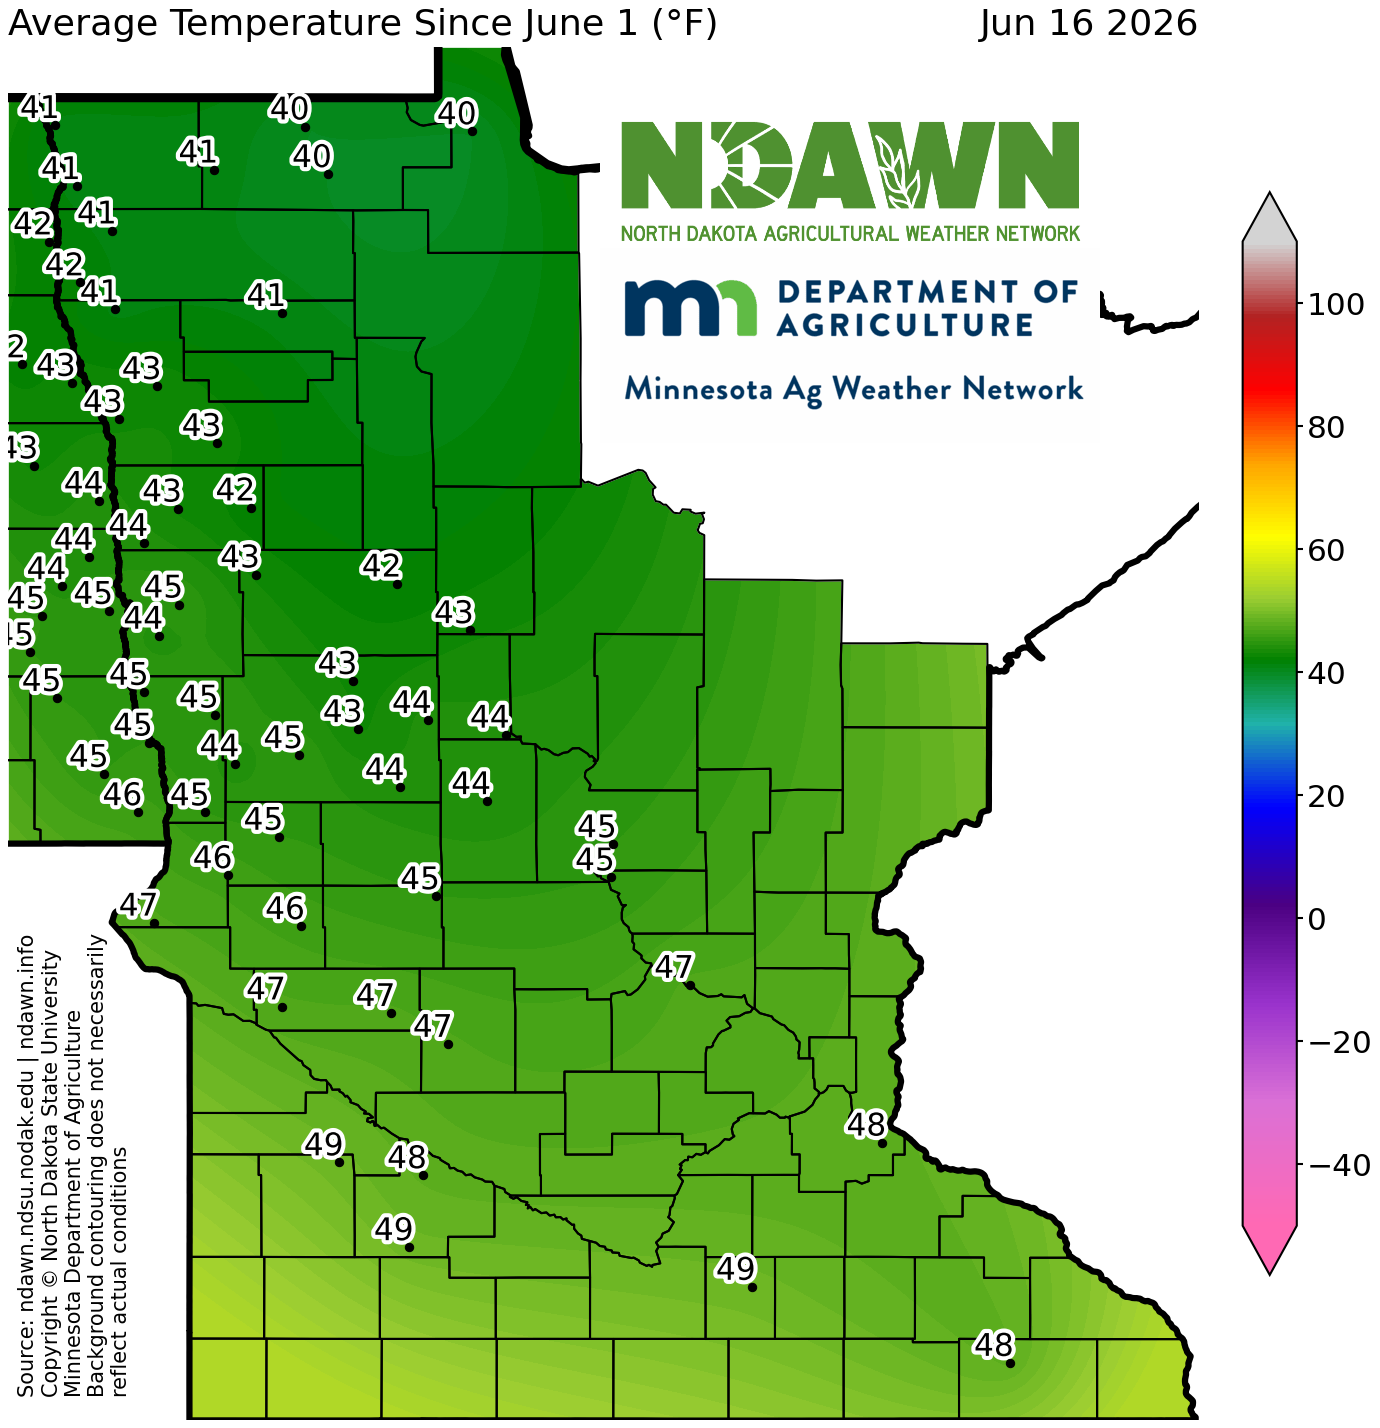
Average Temperature - Since June 1, 2026
View Larger Image
Departure from Normal Temperature
Departure from Normal Temperature - Past 3 Days
View Larger Image
Departure from Normal Temperature - Past 5 Days
View Larger Image
Departure from Normal Temperature - Past 7 Days
View Larger Image
Departure from Normal Temperature - Past 10 Days
View Larger Image
Departure from Normal Temperature - Past 14 Days
View Larger Image
Departure from Normal Temperature - Past 30 Days
View Larger Image
Departure from Normal Temperature - Past 60 Days
View Larger Image
Departure from Normal Temperature - Current Month
View Larger Image
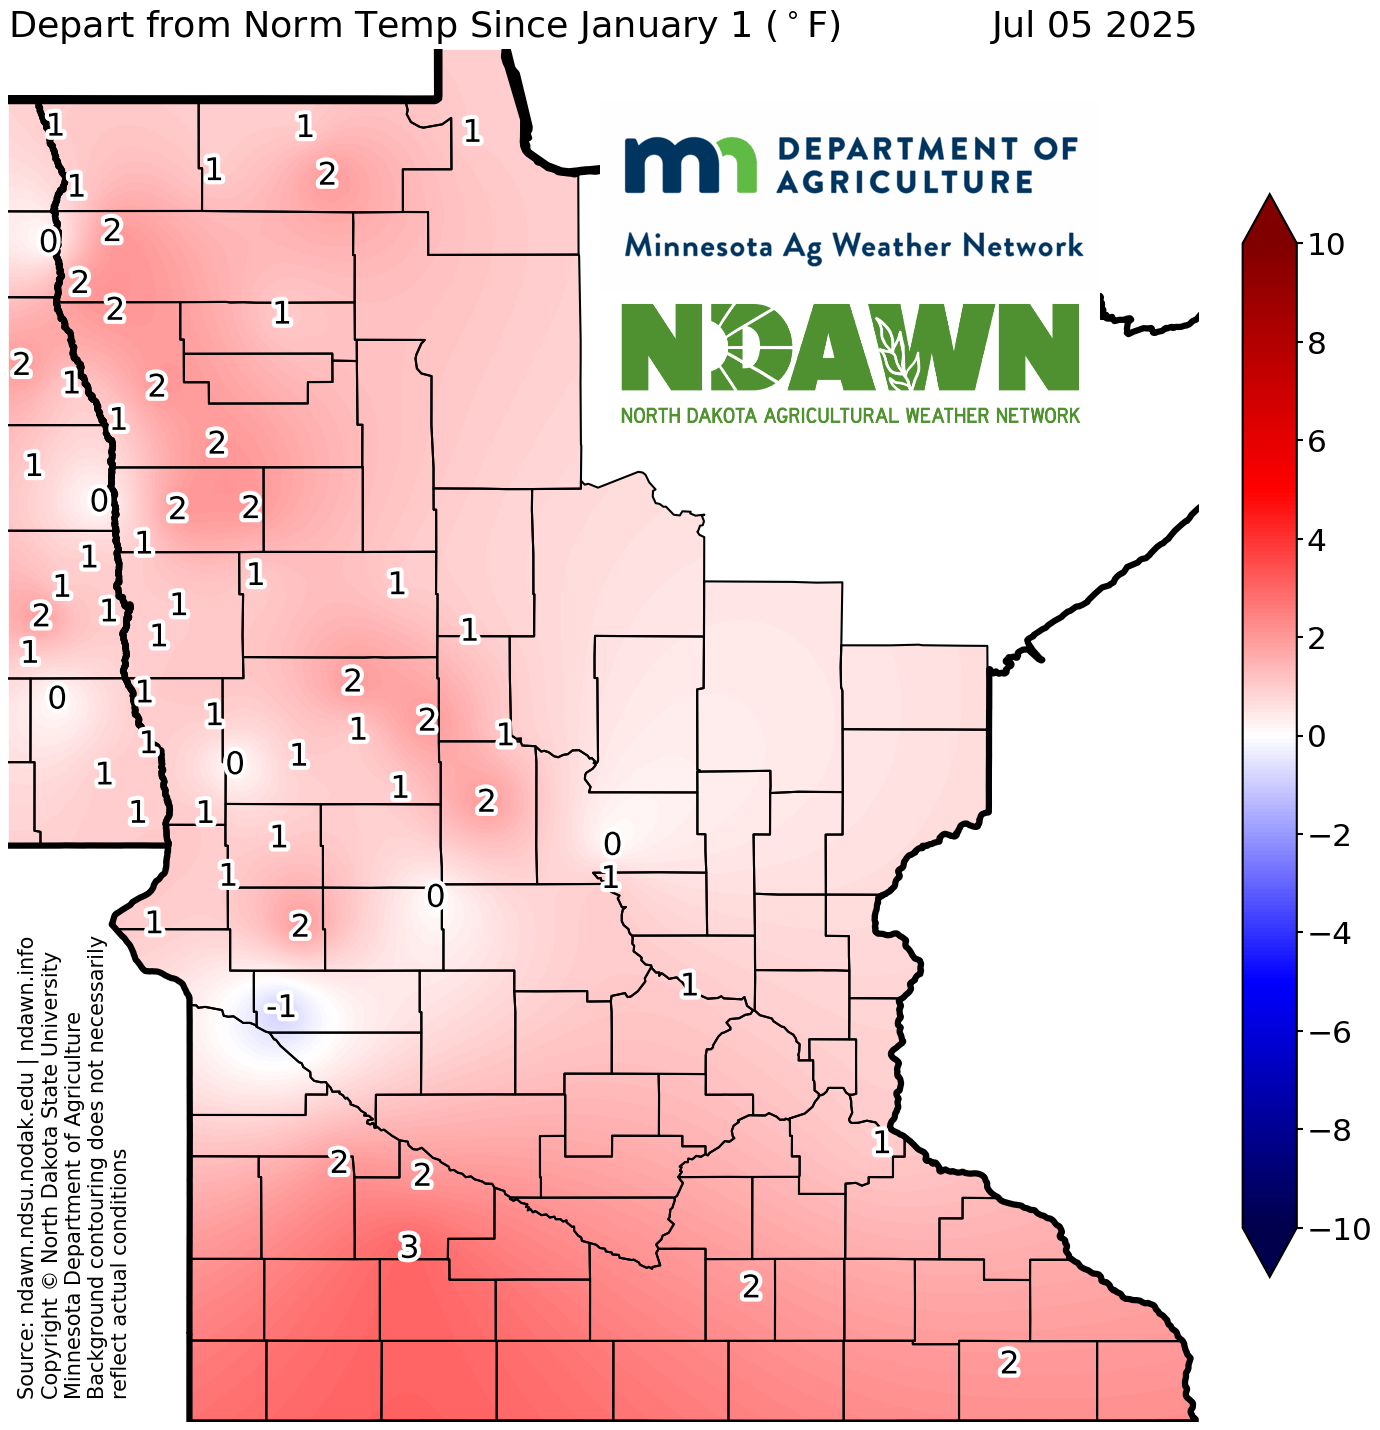
Departure from Normal Temperature - Since January 1, 2026
View Larger Image
Departure from Normal Temperature - Since May 1, 2026
View Larger Image
j
Departure from Normal Temperature - Since June 1, 2026
View Larger Image
Average Maximum Temperatures
Average Max Temperature - Past 3 Days
View Larger Image
Average Max Temperature - Past 5 Days
View Larger Image
Average Max Temperature - Past 7 Days
View Larger Image
Average Max Temperature - Past 10 Days
View Larger Image
Average Max Temperature - Past 14 Days
View Larger Image
Average Max Temperature - Past 30 Days
View Larger Image
Average Max Temperature - Past 60 Days
View Larger Image
Average Max Temperature - Current Month
View Larger Image
Average Max Temperature - Since January 1, 2026
View Larger Image
Average Max Temperature - Since May 1, 2026
View Larger Image
Average Max Temperature - Since June 1, 2026
View Larger Image
Departure from Normal Maximum Temperature
Departure from Normal Max Temperature - Past 3 Days
View Larger Image
Departure from Normal Max Temperature - Past 5 Days
View Larger Image
Departure from Normal Max Temperature - Past 7 Days
View Larger Image
Departure from Normal Max Temperature - Past 10 Days
View Larger Image
Departure from Normal Max Temperature - Past 14 Days
View Larger Image
Departure from Normal Max Temperature - Past 30 Days
View Larger Image
Departure from Normal Max Temperature - Past 60 Days
View Larger Image
Departure from Normal Max Temperature - Current Month
View Larger Image
Departure from Normal Max Temperature - Since January 1, 2026
View Larger Image
Departure from Normal Max Temperature - Since May 1, 2026
View Larger Image
j
Departure from Normal Max Temperature - Since June 1, 2026
View Larger Image
Average Minimum Temperatures
Average Min Temperature - Past 3 Days
View Larger Image
Average Min Temperature - Past 5 Days
View Larger Image
Average Min Temperature - Past 7 Days
View Larger Image
Average Min Temperature - Past 10 Days
View Larger Image
Average Min Temperature - Past 14 Days
View Larger Image
Average Min Temperature - Past 30 Days
View Larger Image
Average Min Temperature - Past 60 Days
View Larger Image
Average Min Temperature - Current Month
View Larger Image
Average Min Temperature - Since January 1, 2026
View Larger Image
Average Min Temperature - Since May 1, 2026
View Larger Image
Average Min Temperature - Since June 1, 2026
View Larger Image
Departure from Normal Minimum Temperature
Departure from Normal Min Temperature - Past 3 Days
View Larger Image
Departure from Normal Min Temperature - Past 5 Days
View Larger Image
Departure from Normal Min Temperature - Past 7 Days
View Larger Image
Departure from Normal Min Temperature - Past 10 Days
View Larger Image
Departure from Normal Min Temperature - Past 14 Days
View Larger Image
Departure from Normal Min Temperature - Past 30 Days
View Larger Image
Departure from Normal Min Temperature - Past 60 Days
View Larger Image
Departure from Normal Min Temperature - Current Month
View Larger Image
Departure from Normal Min Temperature - Since January 1, 2026
View Larger Image
Departure from Normal Min Temperature - Since May 1, 2026
View Larger Image
j
Departure from Normal Min Temperature - Since June 1, 2026
View Larger Image
Consecutive Days
Consecutive Days Minimum Temperature Below 0°F
View Larger Image
Total Days Minimum Temperature Below 0°F
View Larger Image
Consecutive Days Minimum Temperature Below 32°F
View Larger Image
Consecutive Days Maximum Temperature Below 32°F
View Larger Image
Consecutive Days Minimum Temperature Above 32°F
View Larger Image
Consecutive Days Maximum Temperature Above 90°F
View Larger Image
Total Days Maximum Temperature Above 90°F
View Larger Image
Total Days Maximum Temperature Above 100°F
View Larger Image
Total Hours Below Temperature
Totals are calculated from midnight to midnight Central Standard Time and do not include the current day.
Total Hours Below 0°F - Yesterday
View Larger Image
Total Hours Below 10°F - Yesterday
View Larger Image
Total Hours Below 32°F - Yesterday
View Larger Image
Total Hours Below 36°F - Yesterday
View Larger Image
Total Hours Below 0°F - Past 2 Days
View Larger Image
Total Hours Below 10°F - Past 2 Days
View Larger Image
Total Hours Below 32°F - Past 2 Days
View Larger Image
Total Hours Below 36°F - Past 2 Days
View Larger Image
Total Hours Below 0°F - Past 7 Days
View Larger Image
Total Hours Below 10°F - Past 7 Days
View Larger Image
Total Hours Below 32°F - Past 7 Days
View Larger Image
Total Hours Below 36°F - Past 7 Days
View Larger Image
Total Hours Below 0°F - Since Oct 1
View Larger Image
Total Hours Below 10°F - Since Oct 1
View Larger Image
Total Hours Below 32°F - Since Oct 1
View Larger Image
Total Hours Below 36°F - Since Oct 1
View Larger Image